9 free software for scanning and analyzing wifi-networks
To work with large wireless networks, a sufficient number of good multifunctional software solutions is presented on the market, allowing comprehensive testing of WiFi-networks. However, it will be more convenient for a quick look at the radio fleet during the design, deployment or troubleshooting, you will be more convenient to use the simpler tools. We present to your attention an overview of the most interesting free programs for diagnosing WiFi-networks.
As part of this article, we will present you nine free software tools - most of them work on the Windows operating systems, others - under MacOS or Android - which will provide you with basic information about existing WiFi signals in the area: SSID identifiers, signal level used channels, MAC addresses and types of protection of a particular network. Some of them can detect hidden SSIDs, determine noise levels or provide statistics on successfully and unsuccessfully sent and received packages of your wireless connection. One solution includes a toolkit for hacking WiFi passwords, which will be extremely useful to search for vulnerabilities and safety assessments when testing security from hacking your wireless network.
We also note that most of the tools described below are free versions of commercial solutions distributed by the same supplier, but with trimmed functionality.
Acrylic WiFi Home Wireless Local Network Scanners is a trimmed version of the Tarlogic Security Commercial Solution. Version 3.1, discussed under this review article, attracts attention, primarily due to the detailing of the wireless environment and advanced graphic capabilities of the display of collected information. The functionality of this solution includes: overview of the WiFi networks found with support for 802.11 A / B / G / N / AC standards; Detection of unauthorized access points and display connected clients; Scanning and analysis of WiFi channels used by wireless networks at 2.4 GHz frequencies and 5 GHz; Building graphs of the received signal and its power for WiFi access points.
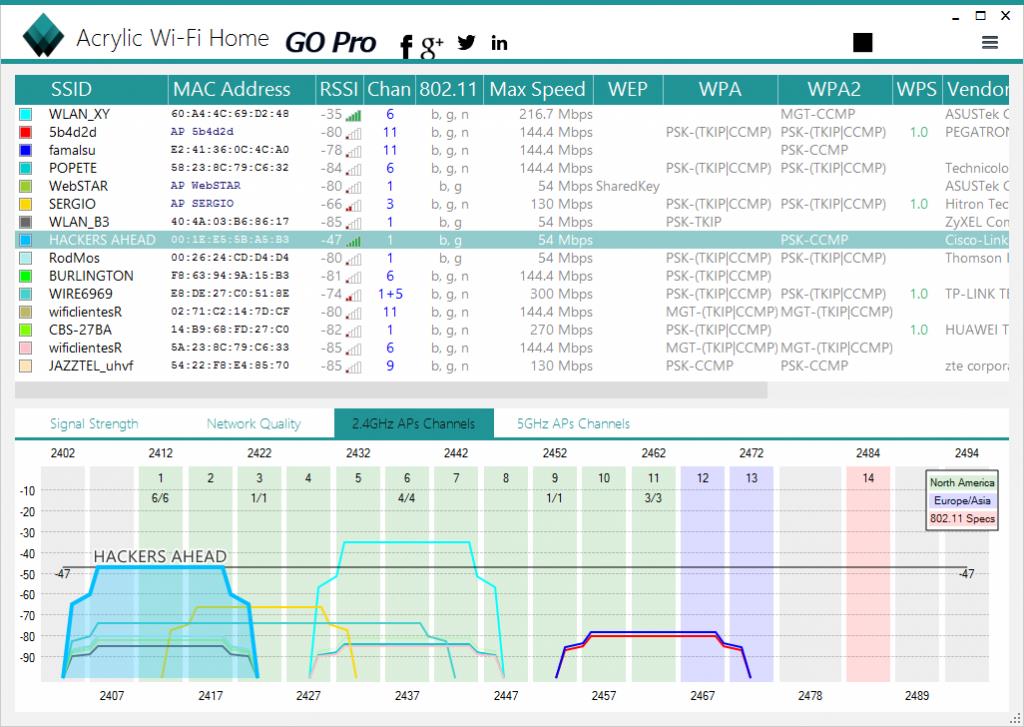
WIFI scanner for Windows Acrylic WiFi Home will allow you to scan and view the available wireless networks in real time, will provide information on WiFi-networks detected (SSID and BSSID), their type of protection and wireless devices connected to the network at the moment, and Also allow you to get a list of WiFi passwords (default by manufacturers) thanks to the built-in plug-ins.
Being a free product, ACRYLIC WiFi Home 3.1 has a simple but attractive graphical interface. The Detailed SSID list is located at the top of the application. Here, in particular, you can find: negative values \u200b\u200bin DBM for the receiving signal level indicator (RSSI) supported by access points or WiFi routers 802.11 (including 802.11ac), the name of the manufacturer, model and MAC addresses Network devices. The solution recognizes the bandwidth used and displays all channels involved for this. It is not looking for hidden SSID, but can show them if network data will be detected by the presence of hidden networks. The application also has functionality for the inventory of WiFi-networks, allowing you to assign and save the names of the detected SSIDs and / or clients (for the free version, this feature has quantitative ways to use).
At the bottom of the application screen, the default is visible rating information on the network characteristics of the selected SSID. Also located here is a graph of the signal level and power of all detected access points. When you go to the advanced mode of displaying the status of wireless networks, you will receive two additional graphics - for the 2.4 GHz band and 5 GHz, where it is simultaneously displayed as information about the channels used, including those in one "wide" channel and Signal level data.
Export or saving captured data is extremely inconvenient, since the software developer has decided to excessively cut this functionality in a free solution: you can copy no more than one line of data into the clipboard and then insert text into a text document or spreadsheet. There is also a function of publishing a screenshot in Twitter.
In general, Acrylic WiFi Home is a good WLAN software scanner, especially considering that he is worthless. It collects all the basic information about your wireless space and clearly demonstrates the data obtained, both in text and graphic form, which is perfect for simple tasks for diagnosing WiFi-networks. The main disadvantage of this solution can be considered large problems with the export of data, or rather, the actual absence of such an opportunity in view of the functional producer itself in a free decision by the manufacturer.
Airscout Live (Android)

The Airscout Live application from Greenlee will turn your Android smartphone to a convenient and portable WiFi network analyzer. Airscout Live has seven modes of operation, four of which can be used completely free without any restrictions for Android devices. Commercial version, unlike free, compatible with most desktops (Windows) and mobile devices (Android and iOS). With the basic functional, you can quickly, mobile and, importantly, you can solve the problems associated with the insufficient WiFi signal level in some places of your office or at home.
Airscout Live will show all the characteristics of the access points detected within the range: from the signal level and security protocols before the equipment features. Allows you to determine the least loaded channel, measure the power of the signal at each WiFi-network point and identify places with an insufficient signal level. It will help to determine the sources of interference by analyzing the parameters of the use of channels in the 2.4 GHz band and 5 GHz. Using the program, you can select the optimal place to locate access points to provide the most high-quality coating of the WiFi network and customize it for maximum performance without buying additional equipment. In addition, the Airscout application allows you to take pictures of the WiFi network and save locally or load them into the cloud.
Aircout Live is a very simple application that does not require additional learning. The user interface looks attractive and intuitively understood. The first two menu items are "TD" and "TD Table" - provide you with visual and comprehensive information about all the characteristics of access points in the visibility zone. Charts cover access points visually will demonstrate the dependence of the signal level of each of them and the loading of the channels in the 2.4 GHz band and 5 GHz. Advanced information in a tabular view about each access point (SSID, MAC address, equipment supplier, used channel, channel width, the received signal level in DBM and security settings) are available in the second in order of the menu item.
The "Time Schedule" item will allow you to see all the access points that detected your Android device at the observed place, and their schedule for changing the signal level in DBM with reference to time. For example, if you explore the network, which consists of several access points, this information will help you understand which level of each of them will be in this place, and how the client device will switch between them. In addition, the choice of a specific access point highlights its signal level, which helps the visual perception of information.
The "Signal Power" item will clearly test the signal level for each access point over time. You can choose a specific SSID and see the current, as well as the minimum and maximum signal level fixed by the device for this access point. The original interpretation of the results obtained in the form of a red-yellow-green speedometer will clearly make sure that this or that function will work in this particular place or not. For example, a stable finding of the signal level in the green zone will tell you that here you will have no problems with such resource-intensive technologies, as voice transmission via IP or transfer streaming video in Full HD format. Finding in the yellow zone will tell about the availability of only web surfing. Well, the red zone will mean big problems with the reception of the signal from this access point in this place.
To use additional features that are not available in the free version of software without additional equipment (identifying the most common problems: suboptimal signal coating or incorrect channel selection; determination of interference sources, including from "non-WiFi" devices; WiFi-network configuration optimization adjacent to networks of Standard 802.15.4; WiFi performance setting by comparing signal intensity parameters and its use; OKLA speed test and much more) You will need an Airscout controller or a kit that includes a controller and remote clients.
Airscout Live is an excellent application that, above all, attracts with its mobility. Agree, have a tool that will always be at hand, it costs dear. In a free version of the product, all the necessary information is available to you, which you may need to quickly analyze the state of small office or home networks WiFi and identify basic problems with their performance. An intuitive interface and competent graphic design of the obtained measurement results not only leave a good impression, but also contribute to the acceleration of work with the application.
CAIN & ABEL is a multi-purpose application for Windows operating systems for recovery and hacking passwords, which is also equipped with tools for intercepting and analyzing network traffic, including WiFi networks. Like the previous decision (Acrylic WiFi Home), CAIN & ABEL is a powerful network analyzer that can capture and process most of the wireless network traffic.
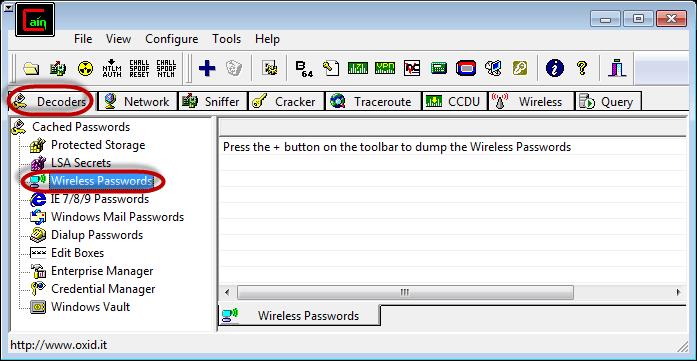
Its graphical interface has a relatively ancient, simplified view. Toolbar (old style with icons at the top of the screen) is used to start various utilities. Access to the main functional parts of the application is carried out through the windows tabs.
Through the Wireless tab ("Wireless Communication"), we get access to functional tools for analyzing network traffic of WiFi-networks. In addition to the usual information on SSID identifiers and various signal information, here you can also find a list and detailed information about connected clients. For Cain & Abel access points and customers, provides information on the number of packets detected: all packets, WEP security protocol initialization vectors (WEP Initialization Vector, Wep IV) and ARP requests. Any hidden SSIDs detected from the intercepted packets will be displayed in the graphical interface. Most of the intercepted statuses and data can be exported to a simple text file.
Despite the huge functional potential of this solution, such disadvantages as the lack of visual graphs, as well as the impossibility of recognizing the 802.11ac standard access points and determine wider channels, do not allow Cain & Abel to be called the best choice for monitoring and analyzing WiFi-networks. It is worth paying attention to this decision if your tasks go far beyond simple traffic analysis. With it, you can restore passwords for Windows, to produce attacks to get lost credentials, study the VoIP data on the network, analyze packet routing and much more. This is a really powerful toolkit for the system administrator with broad powers.
Ekahau HeatMapper is a cartographic software tool for deploying small home level wireless networks and determine the optimal location of the access point setting. This is a simplified free version of professional solutions from Ekahau. This software product provides the same network information as a WiFi-scanner of wireless networks, but also generates a thermal wifi card so that you can visualize signals levels. As part of this review, it will be about version 1.1.4.
The software offers the ability to create a plan or layout of an object, which is studied, as well as the design of the topology of the wireless network by the coordinate grid for approximate orientation.
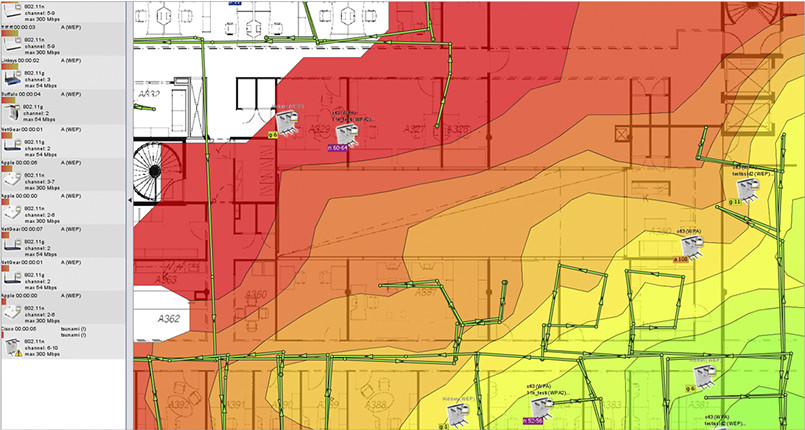
On the left side of the basic user interface screen, a list of wireless networks and their data that are sorted by signal, channel, SSID, MAC address and protection type are displayed. This list includes basic information, but does not contain signal level values \u200b\u200bin DBM and percentage ratio. In addition, the application does not recognize the network with support for the 802.11ac standard, defining them as 802.11n.
Using Ekhau Heatmapper, as when working with other cartographic tools, you denote your current location on the map, while you're going around the building to generate a heat map of WiFi coverage. Ekahau Heatmapper will automatically calculate the location of access points and place them on the map. After all the data are collected, an interactive thermal map of WiFi coverage is formed. So, for example, when you hover the cursor to the access point icon, its coating will be selected; And when you hover the cursor to the area of \u200b\u200bthe heat card, the tipping window will appear for the indicator of the received signal level with a negative value of DBM for this point.
According to reviews, Ekhau Heatmapper software solution is a too simplified cartographic WiFi scanner: from the free version, manufacturers removed almost all additional functionality by making this solution to a truly homework. In addition, the only available opportunity for export or saving is just a screenshot of the card.
Those at least, the Ekahau HeatMapper solution can be used for small networks or to obtain a basic idea of \u200b\u200bhow professional card-based tools work.
Homedale software utility is a relatively simple and portable (not required installation) Wireless network scanners for Windows operating systems (version 1.75 is currently available) and MacOS (currently available version 1.03) with the optional command line interface. In addition to displaying basic information about wireless networks and signals, this utility also supports location definition using GPS and other positioning technologies.
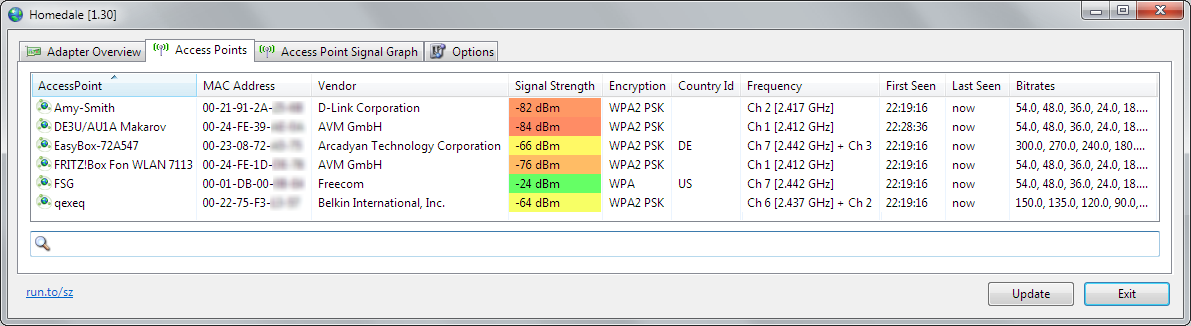
This utility has a simple graphical interface that reminds more dialog box with multiple tabs than a full-fledged application. On the first tab, the Adapters displays a list of all network adapters, as well as their IP gateways and MAC addresses.
The "Access Point" tab contains many important information. It does not have information about the 802.11 standard of each SSID, but here you will find all the supported data transfer rates, as well as the numbers of all channels used by each SSID at the moment, including with a greater channel width. There is also no hidden network transfer here, but other network data is shown, which indicate the presence of hidden SSIDs. Also a very useful feature is the ability to save notes for individual SSIDs, which can then be included in any data export.
In the "Access Point Signal" tab, you will find a change in negative values \u200b\u200bin DBM for the level of the received signal during the time for all selected SSIDs. The implementation of access to this functionality cannot be called very convenient and intuitive - the selection of wireless networks for observation and comparison is made using a double click on the desired SSID from the list of the previous tab "Access points".
The "Usage Frequency" tab illustrates real-time graphical dependence of each SSID frequency sSid (for convenience of channels broken) and signal level values. Visualization of the use of channels is displayed for a range of 2.4 GHz and each subset of the range of 5 GHz. The utility fulfills its task - visually demonstrates the employment of each channel - but it would be more convenient if we had the opportunity to have a single idea of \u200b\u200bthe frequency of 5 GHz, instead of separation into four separate graphics.
In addition, Homedale offers excellent opportunities for free app, for exporting collected data. Thus, it is supported to save the network list in a table form in CSV format, writing to the results of each scan (it will be useful if you move during scanning), as well as save the image of each schedule.
Despite the very simple graphical user interface, the Homedale utility is provided with more advanced functionality than one could expect from it. In addition, I would like to note the rather impressive, as for the free program, the possibility of recording and exporting data, as well as location.
LizardSystems offers a free version of its WiFi SCanner software for non-commercial use, which has the same features and functionality as their paid product. Currently, version 3.4 solutions is available. In addition to WiFi-Scanner, this solution also offers excellent functionality for analysis and reporting.
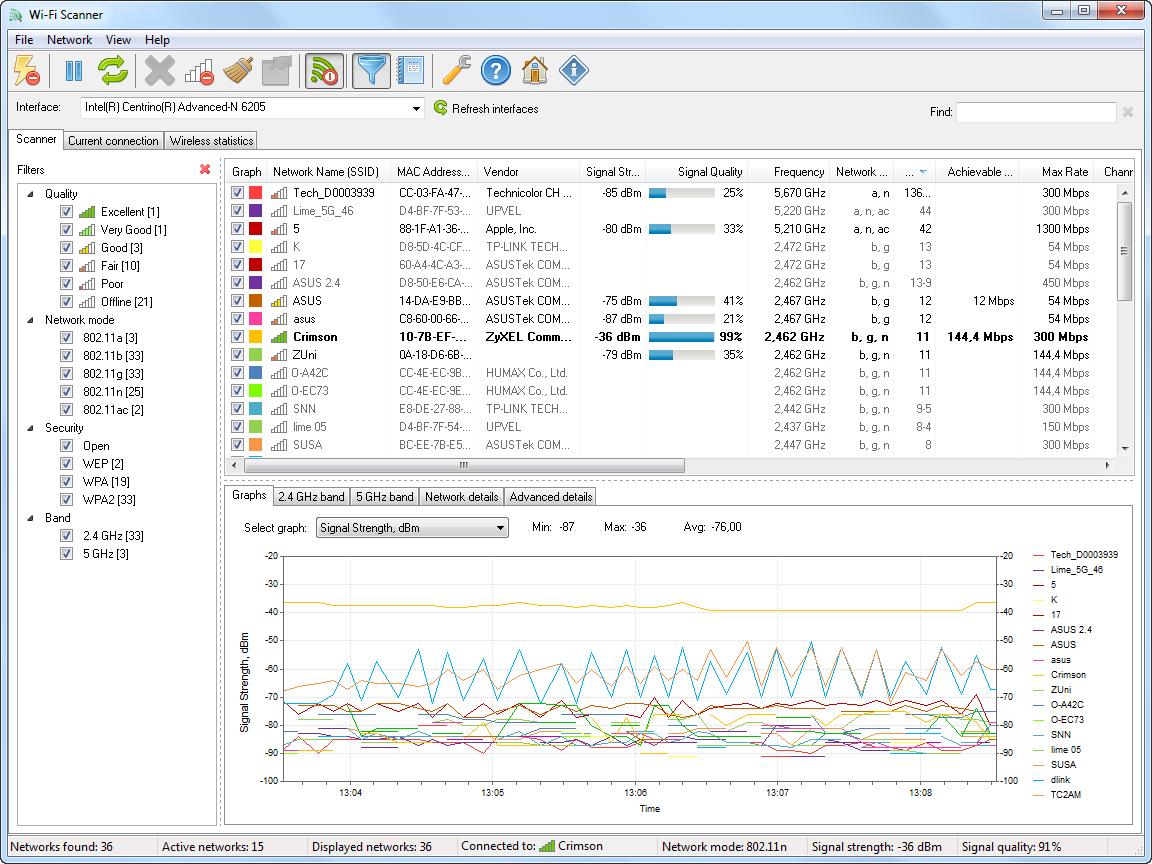
The application has a modern graphical interface, intuitive and easy to use. The Scanner tab contains a list of SSID discovered. In addition to standard detailed information here, you will also find the signal level values \u200b\u200bboth in negative values \u200b\u200bof DBM and percentage. There is even a number of clients that are connected to each SSID. Also, along with the 802.11 standards specification, the solution can determine and report on multiple channels used by any SSID with a greater channel width.
You can use the list of visible SSID to filter input by such parameters: Signal level supported by Standard 802.11, security types and frequency bands used. At the bottom of the "Scanner" tab, graphics are located between which you can switch. In addition to typical schedules with signal level and channels, visualized data transmission speed data, channel load and customer quantities are also available. At the bottom of the screen displays information about the current connection. In the Advanced Information tab, you will find various data on network activity, up to the number of raw packages.
The "Current Connection" tab displays more detailed information about the current wireless connection. Here you will receive access and can manage the list of wireless network profiles stored in Windows 10, which may be useful, since in this latest version of the Windows operating system no longer be provided with access to this list and control them. The "Wireless Statistics" tab presents graphs and statistics for various types of packages, both for a physical (PHY) level and a channel (Mac) level that will be useful for extended network analysis.
The LizardSystems WiFi Scanner software solution offers advanced export and reporting opportunities. Basic functionality allows you to save a list of networks in a text file. In addition, you can generate reports with a brief description of the types of networks found when scanning, with all registered SSID data, by any you added comments and snapshots of graphs. This is a rather impressive opportunity for a wifi scanner in free access.
Thus, WiFi Scanner from LizardSystems is really impressive with its functionality, including the capabilities of filtering data output and reporting, as well as advanced information about the transmitted data packets. It can be an important part of your "hiking" set of tools for servicing and checking wifi-networks, but at the same time remember that the free license is available only for personal use.
NetSpot (Windows and MacOS)
The NetSpot application is a software solution, analysis and improvement of WiFi networks. The commercial version uses a cartographic tool for thermal visualization of coverage areas, however, in the free version for home use it is unavailable. However, this decision is proposed for both Windows operating networks and MacOS. As part of this review article, we consider NetSpot Free Version 2.8 - a free significantly trimmed version of the company's pay products for home and corporate use.
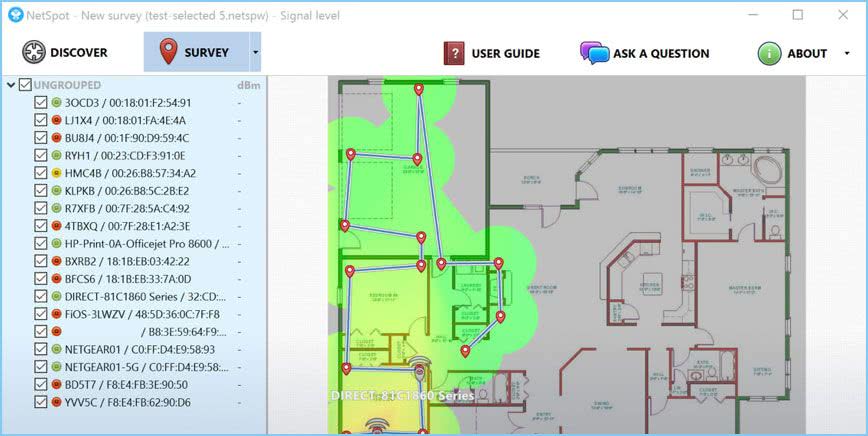
The NetSpot Discover tab is a wifi scanner. Despite the simple graphical interface, it has a modern appearance, and the network details of each SSID are extended by bold and clearly visible. Signal levels are shown in negative values \u200b\u200bof DBM (current, minimum and maximum), as well as in percent. Hidden networks in the free version are not displayed, as is not supported by the ability to export data (although there is such a button, but it is not active).
When you press the "Details" button at the bottom of the application window, combined signals and channels used for each WiFi-band, formed for the SSID selected from the list of networks, are shown. In addition, in a tabular view, information about the signals of each SSID is displayed to see the exact values \u200b\u200bobtained by the application during each scan.
In general, the free version of NetSpot copes well with WiFi-network detection tasks (although it does not support work with hidden networks). And yet, a free solution has a very limited functionality, which we have eloquently say non-working links to a large number of additional features - this is the inaccessibility of visualizations, and the inability to use a thermal map, and the lack of exports.
WirelessNetView (Windows)
WirelessNetView is a small utility from the Nirsoft web resource that works in the background and tracks the activity of wireless networks around you. It is offered for free for personal and commercial purposes. This is a fairly simple WiFi scanner, affordable both in a portable and installation of the form. As part of this article, version 1.75 is considered.
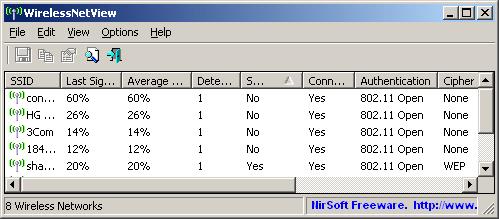
WirelessNetView Solution User's Graphic Interface is not very intricate - it's just a window with a list of wireless networks. For each network detected, the following information is available: SSID, signal quality at the current time, average signal quality for all observation time, detection meter, authentication algorithm, information encryption algorithm, MAC address, RSSI, channel frequency, channel number, etc. .
Thus, the signal level indicators This utility provides in negative values \u200b\u200bof DBM, as well as in percentage ratios for the last signal received and the average for the observation time. But it would be even better if we were also available average values \u200b\u200bfor RSSI specific access point for all observation times. Another unique detail of the available analytical data that offers the WirelessNetView utility is the indicator of how often each SSID is detected, which can be useful in certain situations.
Double-clicking on any of the detected wireless networks will open a dialog box with all information about a specific network, which may be very convenient, because to view all the parts in the main width list, your screen is clearly not enough. Right-click on any network from the list allows you to save data for this particular wireless network or all detected networks in text or HTML files. In the "Parameters" toolbar menu, some parameters and additional functionality are displayed, such as filtering, MAC address format and other information display preferences.
Note that this utility does not have a number of extended functions that we expect to see in modern wifi scanners. First of all, we are talking about graphical presentation of information, full support for the 802.11ac standard and, accordingly, recognizing all channels involved in the access point that can use a large width of the channel. However, the WirelessNetView solution can still be useful for simple monitoring of wireless networks or a small WiFi-space, especially if you find some of the unique functionality of this utility valuable for yourself.
Wireless Diagnostics (MacOS)
Starting with OS X Mountain Lion V10.8.4 and in later versions of operating systems, Apple provides the Wireless Diagnostics tool. It represents something more than just a wifi scanner; It can help discover and fix problems with a wifi connection. But it is best that this is a native toolbox included in the operating system. As part of this review, we will consider the Wireless Diagnostics software solution included in MacOS High Sierra (version 10.13).
To get started, press the "Option" key, and then click on the "Airport / WiFi" icon at the top of the MacOS. You have more detailed information about your current WiFi connection, as well as access to the Wireless Diagnostics label.
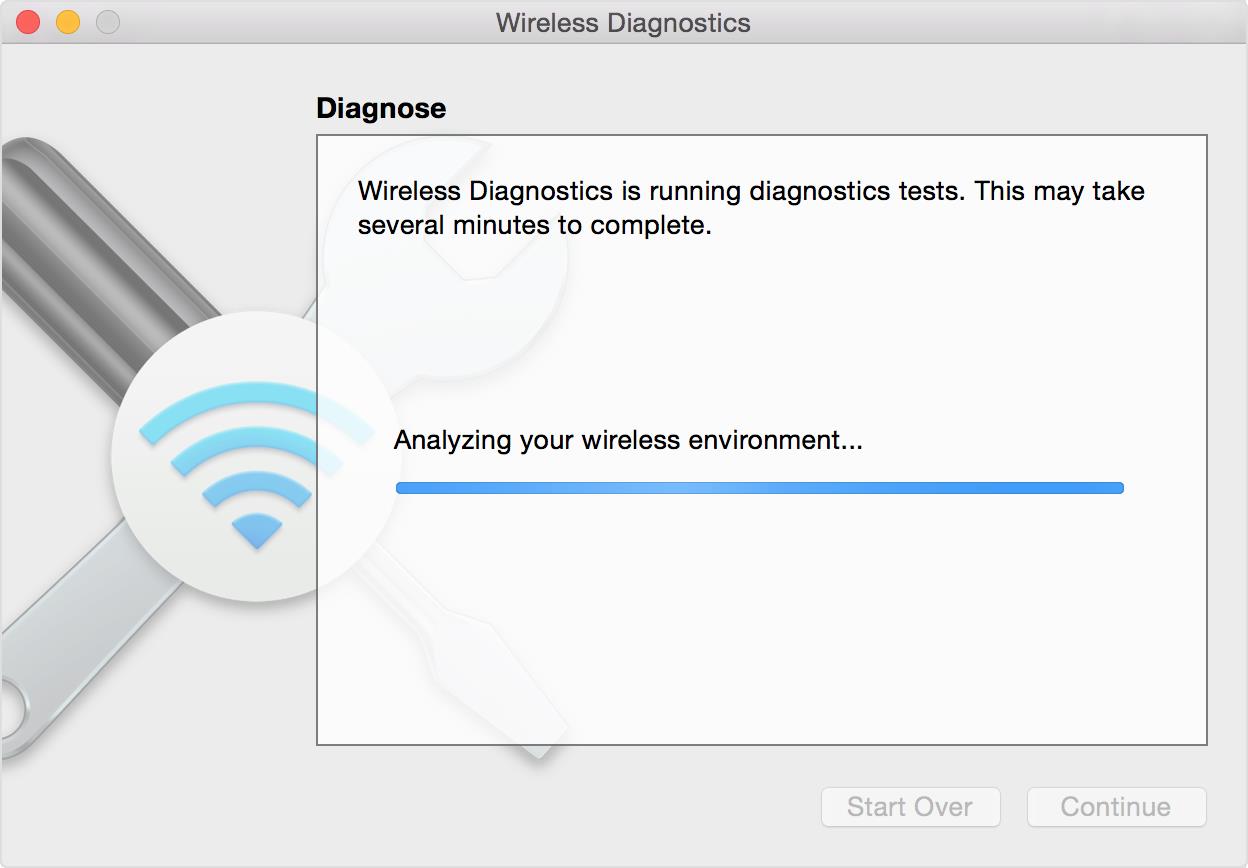
Opening Wireless Diagnostics will launch a wizard called "Assistant", which can request additional data, such as brand and model of the router, as well as its location. Then the tests will be launched to detect problems. After checking, the summary of the results will be shown, and click on the icon for each result will show advanced parts and suggestions.
Although it is not entirely obvious, more tools are also available to you, and not just the aforementioned master. While the wizard dialog box is open, pressing the "Window" button at the top of the toolbar will provide access to additional utilities.
The SCAN utility is a simple WiFi scanner showing the usual data on the detected wireless networks, as well as a brief description of network types and best channels. One of its main advantages is that it shows noise levels in WiFi-channels, which most of the scanners presented in this article are not shown for Windows. However, it was more convenient if all channels would be listed that use specific SSIDs with a larger channel width, and the channel width and the central channel would be shown.
The "INFO" utility demonstrates the current network connection and detailed detailed information about the characteristics of the signal. The "Logs" utility allows you to configure WiFi, EAPOL and Bluetooth diagnostics protocols. The "Performance" utility displays linear graphs of the signal and noise, signal quality and data rates of the current connection. The Sniffer utility allows you to capture untreated wireless packets, which can then be exported to third-party package analyzer.
Thus, the utilities included in the Wireless Diagnostics toolkit of the MacOS operating system families are really impressive, especially in comparison with native wireless tools for Windows operating systems. You always have a wifi scanner at hand (which even shows noise levels) and the ability to capture packets (with the subsequent exportability), and their "Assistant" to troubleshoot seem to be really smart. However, to visualize WiFi channels, in our opinion, there are not enough schedules for the use of channels.
In addition, Apple offers an excellent tour and guide to the use of Wireless Diagnostics.
conclusions
Each of the programs considered by us to diagnose WiFi networks has its advantages and disadvantages. At the same time, all these decisions, judging by the reviews of users, are worthy of downloading and evaluating in action. The choice of the optimal program for each specific case will be your own. So try!
See also:
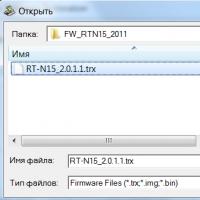 How to make an emergency restoration of the firmware of the ASUS router
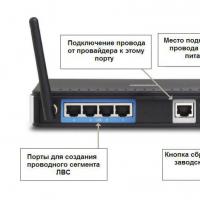 How to set up a D-Link DIR 615 router: Step by step instructions with photos
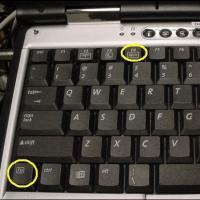 How to enable bluetooth (Bluetooth) on a laptop in Windows 7
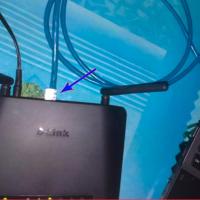 How to set up a Wi-Fi router D-Link DIR-615 yourself
 On Android does not turn on Wi-Fi: possible failures and methods for eliminating
 How to transfer the Internet from the phone to the computer in modern conditions
 Distributed the Internet from a laptop, Wi-Fi network is there, and the Internet does not work?