What is a slope of 12 dB oct. Acoustic system. General concepts and most frequently asked questions. What is multi-way speaker
// What is filter order and cutoff slope?
What is filter order and cutoff slope?
Hi all!
In this video we answer the question of what filter order and cutoff slope are. Let's look
For those who cannot watch the video, there is a text version:
Today we will talk to you about what is cutoff slope, filter order, and so on. You have probably seen such a recording many times that, well, let’s say that in the amplifier’s manual that the filters are 12 dB per octave or 24 dB per octave, or that it is a first-order or second-order filter, let’s talk to you about what it is.
First, let's see how our filter works in principle.
Those. in the picture you see the frequency response, on the vertical scale we have the amplitude in dB, on the horizontal scale the frequency will be in Hz. Let's say we need to cut off some range, let's say the midbass frequency response and say 80Hz and we need to cut off this thing and we cut it with an amplifier or a passive crossover with an active crossover, a processor, whatever. And we get this kind of response. You need to understand that the filter does not cut vertically, that if we cut at 80 Hz, then nothing plays below - no plays, each filter cuts with a certain slope, you can graphically see what the slope is.
In numbers this is indicated:
There are also higher orders, but they are used less often, the main thing is this.
Now let’s understand with you what an octave is and what this notation generally means.
Well, my friends, if we imagine, here is our scale, a change in frequency by 2 times will be an octave, 40Hz-80Hz is an octave, from 80 to 160 is an octave, from 160 to 320 is an octave.
Now look what this entry means, let’s say we have a first order filter, 6dB/octave, let’s say our signal there is 120dB, then we take the octave down and it turns out at 40Hz we will have 6dB lower, i.e. will be 114db. Thus, I cut off the first order filter. If we cut with a second-order filter, then here we will have - 12 dB, i.e. will be 108 db. To understand how much or little this is and how seriously the filter cuts, you just need to imagine that 3 dB is 2 times, 6 dB from the original is 4 times, and so on. Those. even a 6 dB per octave filter makes the sound an octave lower 4 times quieter. Those. you need to understand that the higher the order of the filter, the stronger it cuts, the more rigidly the filter cuts off everything that lies within the range of action of this filter. Well, that is. if we have a high pass filter like here, i.e. the fact that it cuts from below means that it cuts off everything below with a certain steepness of the cut. If we are talking about low pass i.e. a filter that cuts from above means everything above it is cut off absolutely according to the same laws. What filters are used where, how it is used, what are the pros and cons and disadvantages of each filter, we talk about all this in the intensive “car audio from A to Z”, which we will have very soon, come there and there you will learn everything at a lot more details, but for such a review video I think it’s enough. That's all, Sergey Tumanov was with you, if the video was useful to you, put your fingers up, subscribe to our channel, share this video with your friends and come to our intensive course, I will be glad to see you all. Bye everyone, see you!
Two high-ranking employees of the Bashkortostan prosecutor's office, including the first deputy prosecutor, became defendants in the bribery case. Investigators believe that they received 10 million rubles.
Oleg Gorbunov (Photo: Prosecutor's Office of the Republic of Bashkortostan)
The Investigative Committee opened a criminal case of bribery against the First Deputy Prosecutor of Bashkiria Oleg Gorbunov and the Deputy Head of the Department for Supervision of Criminal Procedure and Operational Investigation Activities Artur Sharetdinov. This is stated in a message published on the website of the Investigative Committee.
According to the investigation, both defendants, acting as part of a group and by prior conspiracy, received a bribe in the amount of 10 million rubles. from the first deputy head of the Ufa city administration. This money was payment for the cancellation of the decision to initiate a criminal case in connection with the abuses of city administration officials when relocating people from dilapidated housing. Three intermediaries were also involved in the case, whose names were not mentioned in the report. The Investigative Committee clarified that investigators, together with the FSB, managed to stop Gorbunov’s attempt to leave Russia through Sheremetyevo Airport.
Earlier, a source close to the government of the republic told RBC that a team of investigators from Moscow arrived in Bashkiria. “There is a pre-investigation investigation into the receipt of a bribe,” he said. “The Investigative Committee is checking information that a criminal group was operating in the region, deeply integrated into pro-government structures.” Representatives of this group were connected with the prosecutor's office, judges, and police, the interlocutor noted.
The anti-corruption campaign in the prosecutor's office of Bashkortostan was approved by the head of the Investigative Committee, Alexander Bastrykin, a source familiar with the materials of the audit regarding the management of the prosecutor's office told RBC. “Investigators from Moscow took part in the searches in the office of Deputy Prosecutor Oleg Gorbunov,” he noted. According to the source, the inspection began after a bribe of 5.5 million rubles was caught red-handed. Prosecutor of the Sovetsky district of Ufa Ramil Garifullin was detained.
On Thursday afternoon, law enforcement officers also conducted searches in the apartment and dacha of the deputy prosecutor, RIA Novosti reported, citing a source. The agency's statement said that the operational activities were related to the investigation of a criminal case against a district prosecutor who was detained while accepting a bribe from a Ufa businessman, who also became involved in a case of mediation in bribery and is now testifying to investigators.
Speaker system (General concepts and frequently asked questions)
1. What is an acoustic system (AS)?
This is a device for effective radiation of sound into the surrounding space in the air, containing one or more loudspeaker heads (SG), the necessary acoustic design (AO) and electrical devices, such as transition filters (PF), regulators, phase shifters, etc.
2. What is a loudspeaker head (HL)?
This is a passive electro-acoustic transducer designed to convert audio frequency signals from electrical to acoustic form.
3. What is a passive converter?
This is a converter that does NOT increase the energy of the electrical signal entering its input.
4. What is acoustic design (AO)?
This is a structural element that ensures effective radiation of GG sound. In other words, in most cases, the AO is the speaker body, which can take the form of an acoustic screen, box, horn, etc.
5. What is a single-way speaker?
Essentially the same as broadband. This is an AS, all of whose GGs (usually one) operate in the same frequency range (i.e., filtering of the input voltage using a PF, as well as no filters themselves).
6. What is a multi-way speaker?
These are speakers whose main generators (depending on their number) operate in two or more different frequency ranges. However, directly counting the number of GGs in the speakers (especially those released in previous years) may not say anything about the real number of bands, since several GGs can be allocated to the same band.
7. What are open speakers?
This is an AS in which the influence of air elasticity in the volume of the AO is negligible, and the radiation from the front and rear sides of the moving GG system is not isolated from each other in the LF region. It is a flat screen or box, the back wall of which is either completely absent or has a number of through holes. The greatest influence on the frequency response of speakers with open-type AO is exerted by the front wall (in which the GGs are mounted) and its dimensions. Contrary to popular belief, the side walls of an open-type AO have very little effect on the characteristics of the speaker. Thus, it is not the internal volume that is important, but the area of the front wall. Even with its relatively small size, bass reproduction is significantly improved. At the same time, in the midrange and, especially, high-frequency regions, the screen no longer has a significant effect. A significant disadvantage of such systems is their susceptibility to acoustic “short circuit”, which leads to a sharp deterioration in low frequency reproduction.
8. What are closed-type speakers?
This is an AS in which the elasticity of the air in the volume of the AO is commensurate with the elasticity of the moving GG system, and the radiation from the front and rear sides of the movable GG system is isolated from each other over the entire frequency range. In other words, this is a speaker whose housing is hermetically sealed. The advantage of such speakers is that the rear surface of the diffuser does not radiate and, thus, there is no acoustic “short circuit” at all. But closed systems have another drawback - when the diffuser oscillates, it must overcome the additional elasticity of the air in the AO. The presence of this additional elasticity leads to an increase in the resonant frequency of the moving system of the GG, as a result of which the reproduction of frequencies below this frequency deteriorates.
9. What is a speaker with a bass reflex (FI)?
The desire to obtain a fairly good reproduction of low frequencies with a moderate volume of AO is quite well achieved in the so-called phase-inverted systems. In the AO of such systems a slot or hole is made into which a tube can be inserted. The elasticity of the volume of air in the joint resonates at some frequency with the mass of air in the hole or tube. This frequency is called the PI resonant frequency. Thus, the AS as a whole becomes consisting of two resonant systems - the moving system of the GG and the AO with a hole. With the correctly selected ratio of the resonant frequencies of these systems, the reproduction of low frequencies is significantly improved compared to a closed-type AO with the same volume of AO. Despite the obvious advantages of speakers with FI, very often such systems, made even by experienced people, do not give the results expected from them. The reason for this is that in order to obtain the desired effect, FI must be correctly calculated and configured.
10. What is bass-reflex?
Same as FI.
11. What is a crossover?
Same as a transition or crossover filter.
12. What is a transition filter?
This is a passive electrical circuit (usually consisting of inductors and capacitors) that is connected before the input signal and ensures that each GG in the speaker is supplied with voltage only at the frequencies that they are intended to reproduce.
13. What are the “orders” of transition filters?
Since no filter can provide absolute voltage cutoff at a given frequency, the PF is designed at a specific crossover frequency, beyond which the filter provides a selected amount of attenuation, expressed in decibels per octave. The amount of attenuation is called slope and depends on the design of the PF. Without going into too much detail, we can say that the simplest filter - the so-called first-order PF - consists of just one reactive element - capacitance (cut off the low frequencies if necessary) or inductance (cut off the high frequencies if necessary) and provides a slope of 6 dB/oct. Twice the steepness - 12dB/oct. - provides a second-order PF containing two reactive elements in the circuit. Attenuation 18dB/oct. provides a third-order PF containing three reactive elements, etc.
14. What is an octave?
In general, this is doubling or halving the frequency.
15. What is the AC working plane?
This is the plane in which the emitting holes of the GG AS are located. If the GG of a multi-band speaker are located in different planes, then the one in which the emitting holes of the HF GG are located is taken as the working one.
16. What is an AC work center?
This is a point lying on the working plane from which the distance to the speaker is measured. In the case of single-way speakers, the geometric center of symmetry of the radiating hole is taken as it. In the case of multi-band speakers, it is taken to be the geometric center of symmetry of the emitting holes of the HF main generator or the projections of these holes onto the working plane.
17. What is the AC working axis?
This is a straight line passing through the working center AC and perpendicular to the working plane.
18. What is the nominal impedance of the speakers?
This is the active resistance specified in the technical documentation, which is used to replace the impedance module of the speaker when determining the electrical power supplied to it. According to the DIN standard, the minimum value of the speaker impedance module in a given frequency range should not be less than 80% of the nominal.
19. What is speaker impedance?
Without delving into the basics of electrical engineering, we can say that impedance is the TOTAL electrical resistance of the speaker (including both crossovers and main generators), which in the form of a rather complex dependence includes not only the familiar active resistance R (which can be measured with a regular ohmmeter), but also and reactive components represented by capacitance C (capacitance, depending on frequency) and inductance L (inductive reactance, also dependent on frequency). It is known that impedance is a complex quantity (in the sense of complex numbers) and, generally speaking, is a three-dimensional graph (in the case of speakers it often looks like a “pig tail”) in amplitude-phase-frequency coordinates. It is precisely because of its complexity that when they talk about impedance as a numerical value, they talk about its MODULE. Of greatest interest from the point of view of research are the projections of the “pig’s tail” onto two planes: “amplitude-from-frequency” and “phase-from-frequency”. Both of these projections, presented on the same graph, are called “Bode plots”. The third amplitude-versus-phase projection is called the Nyquist plot.
With the advent and proliferation of semiconductors, audio amplifiers began to behave more or less like sources of “constant” voltage, i.e. they, ideally, should maintain the same voltage at the output, regardless of what load is placed on it and what the current demand is. Therefore, if we assume that the amplifier driving the GG speaker is a voltage source, then the impedance of the speaker will clearly indicate what the current consumption will be. As already mentioned, impedance is not only reactive (that is, characterized by a non-zero phase angle), but also changes with frequency. Negative phase angle, i.e. when the current leads the voltage, due to the capacitive properties of the load. A positive phase angle, i.e. when the current lags behind the voltage, is due to the inductive properties of the load.
What is the impedance of typical speakers? The DIN standard requires that the impedance of the speaker does not deviate from the specified rating by more than 20%. However, in practice, everything is much worse - the deviation of the impedance from the rating is on average +/-43%! As long as the amplifier has a low output impedance, even such deviations will not introduce any audible effects. However, as soon as a tube amplifier with an output impedance of the order of several Ohms (!) is introduced into the game, the result can be very disastrous - coloration of the sound is inevitable.
Speaker impedance measurement is one of the most important and powerful diagnostic tools. An impedance graph can tell you a lot about what a given speaker is like without even seeing or hearing it. Having an impedance graph in front of your eyes, you can immediately tell what type of speaker the data is - closed (one hump in the bass area), bass reflex or transmission (two humps in the bass area), or some type of horn (a sequence of evenly spaced peaks). You can judge how well the bass (40-80Hz) and the lowest bass (20-40Hz) will be reproduced by certain speakers by the shape of the impedance in these areas, as well as by the quality factor of the humps. The “saddle” formed by two peaks in the low-frequency region, typical of a bass reflex design, indicates the frequency to which the bass reflex is “tuned”, which is usually the frequency at which the low-frequency response of the bass reflex drops by 6 dB, i.e. approximately 2 times. From the impedance graph you can also understand whether there are resonances in the system and what their nature is. For example, if you carry out measurements with sufficient frequency resolution, then perhaps some kind of “notches” will appear on the graph, indicating the presence of resonances in the acoustic design.
Well, perhaps the most important thing that can be taken away from the impedance graph is how heavy this load will be for the amplifier. Since the AC impedance is reactive, the current will either lag behind the signal voltage or lead it by a phase angle. In the worst case, when the phase angle is 90 degrees, the amplifier is required to deliver maximum current while the signal voltage approaches zero. Therefore, knowing the “passport” 8 (or 4) Ohms as a nominal resistance does NOT give absolutely anything. Depending on the phase angle of the impedance, which will be different at each frequency, certain speakers may be too tough for one or another amplifier. It is also very important to note that MOST amplifiers DO NOT seem to us to be unable to handle speakers simply because at TYPICAL volume levels acceptable in TYPICAL home environments, TYPICAL SPEAKERS DO NOT require more than just a few Watts to be "powered" by a TYPICAL amplifier.
20. What is the rated power of the GG?
This is a given electrical power at which the nonlinear distortions of the main generator should not exceed the required ones.
21. What is the maximum noise power of the GG?
This is the electrical power of a special noise signal in a given frequency range, which the generator can withstand for a long time without thermal and mechanical damage.
22. What is the maximum sinusoidal power of the GG?
This is the electrical power of a continuous sinusoidal signal in a given frequency range, which the GG can withstand for a long time without thermal and mechanical damage.
23. What is the maximum short-term power of the GG?
This is the electrical power of a special noise signal in a given frequency range, which the GG can withstand without irreversible mechanical damage for 1 s (tests are repeated 60 times with an interval of 1 min.)
24. What is the maximum long-term power of the GG?
This is the electrical power of a special noise signal in a given frequency range, which the GG can withstand without irreversible mechanical damage for 1 minute. (tests are repeated 10 times with an interval of 2 minutes)
25. All other things being equal, a speaker with what nominal resistance is more preferable - 4, 6 or 8 Ohms?
In general, a speaker with a higher nominal impedance is preferable, since such a speaker represents a lighter load for the amplifier and, therefore, is much less critical to the choice of the latter.
26. What is the impulse response of speakers?
This is her response to the “ideal” impulse.
27. What is an “ideal” impulse?
This is an instantaneous (rise time equal to 0) increase in voltage to a certain value, “stuck” at this constant level for a short period of time (say, a fraction of a millisecond) and then an instantaneous decrease back to 0V. The width of such a pulse is inversely proportional to the signal bandwidth. If we wanted to make a pulse infinitely short, then in order to transmit its shape completely unchanged, we would need a system with an infinite bandwidth.
28. What is the transient response of speakers?
This is its response to a “step” signal. The transient response gives a visual representation of the behavior of all GG AS over time and allows one to judge the degree of coherence of the AS radiation.
29. What is a step signal?
This is when the voltage at the input to the AC instantly increases from 0V to some positive value and remains so for a long time.
As long as car audio lasts, the right people will be tormented by the right questions. The right people are those for whom the sound in a car is measured primarily in hertz, decibels, watts, then in liters and millimeters, then in hours and weeks (depending on labor productivity) and only then in dollars and these, what's their name... well, on which the Bolshoi Theater is painted.
What about the right questions? They change over time. First - “what to put in order to play?”, then - “which is better, Crunch or HiFonics?” And finally, “how to design a subwoofer that will play as it should?” Let's start on this note. The laws of nature require good, powerful bass in the hectic interior of a car. That’s how it’s supposed to be, and thank God. Delicate bass farting, appropriate in a home tube system, will simply go unnoticed in a car due to the well-known characteristics of this listening environment. In practice, however, powerful bass in a car turns out to be powerful rather than good. But it’s not supposed to be like that.
Life is easy for homebodies: the frequency response of speakers, filmed in free space and published in a reputable publication, will more or less accurately be transferred to a cozy home environment. Well, there, plus or minus, closer to the wall, further away, these are small splashes. The acoustics of a car interior influence bass reproduction in a very fundamental way. At the level of the method of their reproduction, we will not be afraid of such a strong statement.
The whole point here is that the bass acoustics, which radiate powerful low-frequency sounds into the cabin, operate in a space whose dimensions are comparable to the dimensions of the emitted sound waves. And this radically changes the acoustic response of the interior space, of which we, many sinners, are a part, because we sit within its confines.
Failure to take this powerful effect into account, or at least from insufficient attention to it at an early stage of the conscious activity of the “right person,” creates a desire to make a subwoofer that, according to all calculations, will play right up to 20 Hz exactly, as if on a ruler. When such a project happens to be implemented (fortunately, not often, it is also not easy), the result becomes a great disappointment for its creator. An acoustic miracle, transferred into the cabin, turns into an acoustic monster at the very moment when the car door or trunk lid slams. Alles, gentlemen, the Ten Commandments no longer apply here. In the most severe, peak case, at this stage an understanding comes: a car subwoofer must initially be designed taking into account the load it will operate on. More often, by the will of Allah, understanding occurs before a noticeable amount of expensive lumber is wasted on a dead project.
So let's figure it out. For those who came across this publication during takeoff, let us explain that there is a “transfer function of the cabin.”* (*Actually, its correct name is “acoustic characteristic of sound transmission.” But the term “transfer function” has somehow already taken root, so that we will spit on GOST and will use what is more familiar)
For those who are already in flight, we will try to answer the painful question: what transfer function should be included in the calculations and how much can the resulting theoretical forecast be trusted. To each his own, so to speak.
So what happens when there's a loudspeaker hard at work inside a real car? At medium frequencies (Fig. 1), the sound wavelength emitted by it is less than even the smallest linear dimension of the cabin (usually height). Acoustic waves emitted by the loudspeaker propagate inside the cabin like a traveling wave, are reflected from the boundaries of a closed space, return to the emitter, in general, a cheerful whirlwind of waves occurs. At some frequencies the waves become standing (this is when the size of the cabin turns out to be a multiple of the wavelength), nodes and antinodes of sound pressure appear there, but we are not talking about them now. As the frequency decreases, the moment approaches when even half the wavelength of the emitted signal turns out to be greater than the longest dimension of the cabin (usually, you know, the length). This moment is called the boundary of the compression zone, in which the acoustic response changes radically.
rice. 1
See: As long as the frequency is relatively high, the air vibrations created by the speaker travel in the form of waves. At one point there is an area of high pressure, a little further away, at a distance of half a wave - low pressure. And when the frequency is so low (and the wavelength is so long) that less than half a wave fits along the entire machine, no one runs anywhere. The alternating pressure created by the speaker changes in the entire space of the cabin in phase: everywhere towards an increase or everywhere towards a decrease, as if the speaker were a pump that periodically pumps or, conversely, pumps out air from the cabin. When the wave runs back and forth, the leading role in the formation of sound pressure is played by the oscillatory speed of the diffuser, and it is assumed to remain constant when a signal is supplied with a horizontal frequency response. And within the compression zone, the main factor becomes the amplitude of vibrations of the diffuser. But it increases with decreasing frequency, as anyone who has ever looked at a speaker diffuser “in action” has seen.
 Therefore, here arises the effect with which nature tried to compensate for at least part of our adversity. Within the compression zone, the sound pressure, with the same power of the input signal, increases in inverse proportion to the frequency, with a characteristic slope of 12 dB/oct. So goes the theory. The same theory states that the inflection point of the frequency response, below which its rise begins, is the frequency half of the wavelength of which lies exactly along the interior.
 Many very authoritative sources recommend using such a model and even provide a formula for calculating the frequency below which the frequency response begins to rise. In the metric system (most authorities in this field operate in imperial feet) it would work out like this: f = 170/L. f here is the frequency, in hertz, of course, L is the length of the cabin in meters. Since frequency response curves are not brushwood, they are not broken on the knee, the simplest model of the transfer function will be a curve similar to the one in Graph 1 somewhere nearby. The textbook frequency response of a second-order filter with a quality factor of 0.707.
 This theory itself, as well as the effect it describes, is a real blessing, something we have so little of. Here, for example, is the family of frequency response of a certain abstract subwoofer in the form of a closed box with different lower limit frequencies. In a free field (the three lower curves in Chart 2), frankly speaking, it is not impressive. The far left (red) - no matter what, the decay begins at 35 Hz. And the far right is actually a sunset, it would seem, what the hell is a subwoofer here. The frequency response decline begins as early as 70 Hz. Now let’s recalculate the same frequencies, but taking into account the compression effect, taking the value of about 65 Hz as the cutoff frequency of the compression zone, for example. This, according to theory, corresponds to a cabin length of about 2.5 m. The figure is quite realistic.
 Look what happens: the right, seemingly completely dead frequency response turns into a proud, jewel-like horizontal characteristic. And the far left one gives a big, what is there - a huge boost in response below 60 Hz. Why this happens is understandable. The frequency response of a closed box has a slope of 12 dB/oct. below the limit value. And the frequency response of the cabin is a rise of the same steepness. If two frequency values coincide (as for the green curve), it turns out, according to theory, complete mutual compensation and, as a result, a strict horizontal straight line. In this example, the total quality factor of the speaker in the Qtc design was taken as optimal, equal to 0.707. We considered the quality factor of the interior transfer function to be the same, within the limits of a simple model. In fact, even if we operate with the simplest model, the subwoofer’s quality factor may differ from Butterworth’s, and near the cutoff frequency the total frequency response of the “subwoofer + salon” will acquire some undulation. You should have seen such frequency responses in our tests of subwoofers, where just such a purely theoretical model was used.
Here it must be said that the ideal horizontal frequency response is not the best solution. To the ear, such a sound is perceived as boring even in a stationary car, but when driving it is completely drowned in infra-low rolling noises. In practice, the bass frequency response is always made slightly elevated at the bottom. Moreover, as we will soon see, there it will be shortened by other factors of the acoustic environment.
 It's more fun with bass reflex subwoofers. There, the decrease in frequency response below the tuning frequency should occur with a slope of 24 dB/oct. Therefore, even if the port tuning frequency and the cutoff frequency of the compression zone coincide, the total frequency response will still have a rolloff with a frequency of 12 dB/oct. True, phase inverters are always tuned to lower frequencies, which is what they are made for. It turns out that while the frequency response of the subwoofer is still horizontal, the transfer function raises the characteristic. And then, when the subwoofer’s frequency response begins to decline, the total characteristic collapses. The result is a hump on the overall characteristic. There will always be a hump. But what it will be depends on a larger number of parameters. An example is the family of frequency response of a phase inverter “in an open field” with different tunnel tuning frequencies and how this is transformed in the cabin (Graph 3). From a sharp hump at 50 Hz to a smooth rise to the 20 Hz mark. “Say when,” as the Americans say, when pouring.
 This level of elucidation of the relationship between the frequency characteristics of the subwoofer and the interior is usually included in well-known computer programs for calculating bass acoustics. Several values of the characteristic frequency of the transfer function are given: say, 50 Hz for a large machine, 70 for a medium one, 80 for a compact one. Or, for those who are more generous, they recommend calculating it yourself using the simplest formula: 170 divided by the length of the cabin in meters and behold, the magic frequency is in front of you.
This is where the standard (though still valid) questions usually arise. What kind of car do I have - medium or compact? This is where it is considered. And if you measure and divide, then from where to where to measure? In a hatchback, from the pedals to the threshold of the fifth door or from the speedometer to the rear window? In a sedan, should we consider the trunk separated from the passenger compartment or - in the same place, in a heap? And then, if everything is so smooth, then why is there not a lot of frequency characteristics visible, as in the sweet graphs from the previous examples? Yes, because this is all a theory, and, as you know, it does not give an answer, it gives a direction to the answer.
To compare with practice, real transfer functions of the interiors of several types of cars were sequentially measured using the same subwoofer, with a thoroughly measured frequency response in free space. All main VAZ body types plus three foreign hatchbacks of different sizes.
 Since the acoustics of the cabin affects the sound pressure inside not only at the lowest frequencies, but also at the middle ones, the measured frequency responses were at different heights above the frequency axis. Since we are not discussing the absolute amplification of the sound field in the cabin, but the shape of the frequency response of this field, the curves were reduced to a common level, combining them at around 80 Hz. What happened is in Graph 4, in front of you. It doesn't take a hawk's eye to see that the practical details of the cabin transfer function resemble the theoretical curve only in the most general terms. And the details, the details! Where, one might ask, does such intricacy of practice come from in comparison with the ascetic simplicity of theory? And here's where it comes from. The physical model on which the simplest theory of the compression zone is based represents a car in the form of an absolutely rigid pipe, as if carved into a rock, in which only the end walls reflect sound, and the side walls do not reflect sound.
 A real car, firstly, is full of reflective surfaces, and secondly, it is significantly non-rigid. The first factor is responsible for the bizarre waves above 100 Hz, where standing waves begin to occur. The second, the non-rigidity of the body, causes distortion of the frequency response of the transfer function at lower frequencies, far inside the compression zone. Between 50 and 80 Hz all curves behave surprisingly well.
“Body non-rigidity” is a conditional expression, since it represents two phenomena.
One is membrane vibrations of body panels under the influence of pressure pulsations inside. Remember, within the compression zone, pressure pulsates throughout the entire cabin at the same time, so thin steel panels and glass, fixed in elastic seals, breathe in time with pressure fluctuations. How this happens is well known to everyone who has ever watched an SPL competition: where the vibrations of glass and body panels are felt by hand, and even visible to the eye. At the same time, one must understand that each oscillating part still strives to play at its resonant frequency, which is where characteristic humps and dips appear in the frequency response.
The second is the influence of leaks, which even in the calculations of subwoofers is proposed to be taken into account by the Qb coefficient. The car body even more so has these losses, and in abundance. There are inevitable cracks and leaks - time. There is a deliberately designed body ventilation system - that's two. This whole thing begins to take its toll precisely at the lowest frequencies, in the compression zone. Moreover, the lower the frequency, that is, the lower the expected speed of air movement through the holes, the stronger their influence.
These two phenomena taken together are responsible for the fact that in practice the irrepressible increase in output at the lowest frequencies is never realized. Not rarely, but never. However, we are often talking about frequencies of 20 - 25 Hz, this is where the body turned out to be quite rigid and airtight. But it happens that already at 30 - 35 Hz the frequency response deviates far from the general line prescribed by theory.
What to do now, one wonders. I mean, where should a peasant go? According to the graphs for real cars, it turns out that with the theoretical frequency response curve you still hit your finger in the sky. But this is a pessimistic point of view. The optimistic one is: “Yes, with a finger. Yes, to the sky. But still to the sky, and not to the ground, and this is already progress...”
 Charged with optimism, we will try to consolidate our success. To begin with, we attempted to generalize the individual curves by averaging the acoustic gain values at each frequency. The result, although quite complicated, is, in any case, an understandable curve (black in Graph 5). There they also drew a theoretical curve, as it should have been according to the compression model. Don’t look at the third curve, the blue one, for now; there’s a special discussion about it. But these two, the “hospital average” and the theoretical, turned out to be enviably close in the range from 40 to 80 Hz. Below 40 the average curve sags noticeably in relation to the theory, and above 80 Hz something begins to happen that does not fit into any theory.
 In principle, this is a ready-made practical result. But, not even trusting themselves, as the late Muller prescribed, they decided to compare the results obtained and the already formed recommendations with those given by the classics of the genre. Tom Nysen, the chief expert of the American magazine Car Stereo Review, played the role of a classic here. Back in 1996, he published a paper where he studied the transient function of the cabin, mainly with the goal of answering the question of whether the location and orientation of the subwoofer in the trunk affects the bass level. Indeed, many people note that the nature of the bass depends very much on where the subwoofer is installed in the trunk and where the speaker is directed. Tom’s conclusions, not unfounded, but confirmed by a huge number of measured characteristics, turned out to be quite non-trivial. The main ones are two. First: the position of the subwoofer has virtually no effect on the reproduction of frequencies below 80 Hz. Second: it affects the frequency response in the frequency band 80 - 100 Hz, and in the most decisive and unpredictable way. As a by-product of his research, Tom formulated his recommendations for choosing a transfer function calculation model, which, in his opinion, is universal. In any case, he argued in his article that with the help of the dependence he proposed, the range of bodies from the Chevrolet Corvette (his personal transport at that time) to the Ford Aerostar was covered: approximately from the Tavria, therefore, to almost the Gazelle.
Tom provided a table in his article that can be used to construct a universal curve. We built it, this is the third one, the blue one in the picture. The blurred color indicates the “twilight zone” of unpredictable results. In general, as we see, the coincidence with our results is almost suspicious. Even the twists on the average curve (black) fell exactly where, according to the American guru, they were supposed to be. In the terminology of the classical compression zone theory, the universal Tom Nusen curve corresponds to a transition frequency of 63 Hz with a quality factor Q = 0.9. “Our” theoretical curve had the same frequency, but the quality factor was lower, Q = 0.7.
There seems to be a paradox, if you read it carefully. We started with the fact that the transfer function directly depends on the size of the cabin. Like for health. And we ended up with a universal curve in which the cabin size does not appear at all. How so? Everything is in order, comrades, if you look wider and more closely. As we said, the shape of the frequency response (and not its height above the frequency axis) in the range of 40 - 80 Hz turns out to be predictable and especially does not depend on the ordinate of the inflection point. The size of the cabin would, in theory, determine the shape of the curve near the inflection point, determining exactly where the inflection would occur. And there, as we ourselves have seen, and thanks to the exploits of Tom Nusen, the elegant theoretical curve still turns into stormy waves, so the actual moment of transition is lost in the sea foam.
So let’s now look at everything that has gone before and formulate conclusions in all the beauty of their practical applicability.
1. You no longer need to dream about getting somewhere the real, correct, final transfer function of your car - choose from the menu. The menu is not long, but maybe you'll pick something...
2. ...only there is no particular meaning in this. You won’t straighten the frequency response of a subwoofer in the hope of getting into the features of the transfer function curve?
3. In practice, the theoretical dependence can be used. Moreover, you can simplify your life by limiting yourself to one single transfer function curve for all occasions. With this approach, you will get within the boundaries of the site, using sports terminology. Or rather, you won’t get it, no matter how individual the curve you apply is. After all, exactly where it begins to be individual, the frequency response begins to jiggle, caused by many factors that are not included in the theory of the compression zone.
4. At the lowest frequencies, your real frequency response will “disappear” from the theoretical one and will go lower. How much lower depends on the characteristics of the body and even on its technical condition. It is almost impossible to influence this characteristic, because we are not talking about vibration damping (you thought about it, admit it), but about mechanical rigidity. But toughness is a different story. Look at the SPL combat vehicles with their frames, bolted windows and so on. Look and forget. Trust fate.
5. The boundaries of the “bumpiness” The frequency response at the boundary of the compression zone in most cases coincides with the area of dividing the bands between the subwoofer and midbass. This is where the main battles will take place. You have to play with the location of the subwoofer and its orientation, not to mention the selection of crossover filter frequencies. Then thank the crossover designers who were not too lazy to make the high-pass filter and low-pass filter with separate adjustment.
6. A bass equalizer, when it is in an amplifier, would be most needed not at frequencies of 40 - 50 Hz, as most often happens, but at 25 - 40 Hz. Here, with its help, you can really correct the frequency response, which sags due to losses due to deformation and leaks. So, if you see one like this (they do), take note.
In conclusion. If you use subwoofer calculation programs where the cabin transfer function is specified as the inflection point frequency, take 63 Hz and don't think about anything else. It still won't be more accurate. If there are frequencies and quality factors, take the same frequency, and the quality factor - from 0.7 (“our curve”) to 0.9 (Tom Nusen’s curve). Who do you trust more?
And finally, if you have a program where interior acoustics are specified by points (for example, JBL Speaker Shop or Bass Box from Harris Technologies), transfer the reference points of the transfer function there according to the table below, and then double-click on 125 Hz to normalize the curve .
Due to the fact that, as it turned out, many people do not understand at all what multiamping is, what its principle is, how it is done and why, I had to write this short explanatory article.
First, a small schematic drawing - explanations below:
Any device designed to effectively radiate sound into the surrounding space contains several loudspeakers (speakers) built into one or another acoustic design (casing), as well as a passive electrical circuit called transition filters (crossover). This circuit (consisting of inductors, capacitors and resistors) is turned on before broadband input signal (i.e. after the speaker terminals but before the speakers) and ensures that each speaker in the speaker receives voltage only those frequencies for which they are designed and which they are designed to reproduce. Exception constitute only broadband Speakers in which the division of the input signal into “bands” is completely absent - the entire width of the band is supplied directly to the terminals of the (usually one) speaker.
Because no real a filter cannot provide absolute voltage cutoff at a given frequency; it is designed for a certain crossover frequency, beyond which the filter provides a selected amount of signal attenuation, expressed in decibels per octave. In general, an “octave” is a doubling or halving of frequency. The amount of attenuation is called “slope” and depends on the filter design. Without going into details, we can say that the simplest filter - the so-called 1st order filter - consists of only one reactive element - capacitance (if necessary, cut off the low frequencies from above) or inductance (if necessary, cut off the high frequencies from below) and provides a slope of 6 dB/ Oct. Simply put, this means that if, for example, in a two-way speaker you select a crossover frequency of 2 kHz and the first order of filtering of both speakers, then the woofer signal at a frequency of 4 kHz should be attenuated by half, and at a frequency of 8 kHz - four times, etc. Similarly with the tweeter - only at frequencies of 1 kHz and 500 Hz, respectively. Twice the steepness – 12dB/oct. – provide second-order filters containing two reactive elements in the circuit. Attenuation 18dB/oct. They provide third-order filters containing three reactive elements, etc. Filters of higher orders are used quite rarely.
Another aspect of the problem is that the individual speakers that need to be “linked” together within the framework of a complete speaker system are characterized by various sensitivities, i.e. simply put, they all sound at different volumes at the same applied voltage. Accordingly, the task arises of reducing the sound volume of the more sensitive speakers to the level of the least sensitive in the system. This is ensured by including resistors in the transition filters, across which an additional voltage drop occurs, i.e. signal attenuation (attenuation by overall level, regardless of frequency).
Transition filters, built into speakers in a standard way, are a fixed thing and not always executed in an ideal way. This is especially true for equalizing the sensitivity of different speakers among themselves. Therefore, in some cases (but not always) it is possible to improve standard development by completely shutdowns passive filters, freeing the speaker terminals and connecting the signal to them directly- With individual power amplifiers (one for each pair of identical speakers). This is called multiamping. Thus, for two-way speakers you will need 2 separate PAs, and for three-way speakers - 3 PAs. For broadband users this is irrelevant - there is always 1 mind. It is extremely important that all PAs used are either strictly identical or have the ability to adjust the input sensitivity. This is necessary so that with the same voltage at the input of each PA, the output (to an identical load) will also be exactly the same voltage.
Here the question naturally arises: okay, we took the speakers, threw out the standard crossovers from them, left only the cabinets and speakers, each of which was powered by its own PA - how can we feed a broadband signal to 2-3 amplifiers??? An external electronic adjustable crossover serves this purpose. Such a device has one input for connecting a pre-amplifier-switch and some outputs to power amplifiers. At the same time, the electronic crossover allows flexible band separation - everything is adjustable within a wide range: transition frequencies, cutoff slope and attenuation depth in each strip. In other words, electronic crossover is connected in the gap between the preamplifier and power amplifiers.
Here, for example, is an example of a magnificent 4-way electronic crossover from Pioneer:
Thus, in the hands of the user it turns out most powerful tool for precision coordination of bands in the speakers. There is only one serious problem along the way - it is absolutely forbidden to make adjustments by ear. Serious acoustic measurements are required. I use one of the best measuring systems in the world - MLSSA. Answers to any questions regarding the technical characteristics and capabilities of this measuring system (how it measures, what it measures, what it measures with, etc.) can be found on the manufacturer’s website.
Typically, converting speakers to multiamping is done as follows. Firstly, speakers are selected that do not disfigure the housing, but initially provide direct access to the speakers:
Secondly, the speakers are initially matched according to the criterion of the most even axial (anechoic) frequency response. And finally, the speakers are installed in the proper places in the room and fine-tuned for a specific room and listening area. That's all.
 Add an arbitrary phone number in the personal account of the mobile operator Kyivstar (Ukraine)
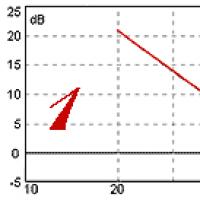 What is a slope of 12 dB oct
 Data roaming abroad
 Connect to a remote desktop using the built-in Windows RDP client
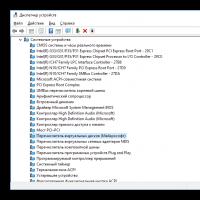 How to find out the motherboard socket through a computer
 If Windows cannot be installed on this disk
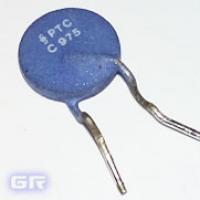 Thermistor - characteristics and principle of operation