Inkscape is a vector graphics editor. Work technology in the program Inkscape Independent work in inkscape for students
Inkscape is a very popular open source vector graphics editor that can run on both Linux and Windows and MacOS operating systems. The difference between a vector graphics editor and a raster one is that drawing is performed not using pixels, but using various shapes and formulas. This has certain advantages, for example, the image can be scaled without loss of quality.
In this article, we will look at how to use Inkscape for drawing and image manipulation. Let's talk about installing the program itself and using shapes.
It is a fairly popular program that you can install it very easily. In Linux distributions, the Inkscape vector editor is available from the official repositories, for example, to install on Ubuntu, you need to run the command:
sudo apt install inkscape
To install on Red Hat and CentOS systems, run:
sudo yum install inkscape
If you want to install the program on Windows, then the installation file can be downloaded from the official website. In addition to the version for Linux, Windows and MacOS, you can download the source code and build the program yourself. When the installation is complete, you can find the program in the main menu:
How do I use Inkscape?
Now let's take a closer look at how to use the utility. But you need to start by parsing the utility interface.
1. Program interface
Immediately after starting the program, you will see the following main window:

The program interface is quite simple and looks much clearer than in the same Gimp. It can be roughly divided into several areas:
- Menu- located at the very top of the window, with the help of it you can select various options and parameters of the program;
- Toolbar- located immediately below the menu, there are frequently used tools that you need to be able to easily access;
- Drawing tools- the panel with drawing tools is located on the left side of the window and is located vertically;
- Workspace- canvas for drawing, located in the center of the window;
- Action tools- the action toolbar is located to the right of the work area;
- Bottom panel and palette- at the very bottom of the window there is a panel with several tools for adjusting shape parameters and a color palette.
You will also often need to use various hotkeys to navigate the document and select some functions. Here are the main ones:
- Ctrl + arrow- to move around the sheet. You can also move using the mouse wheel vertically and holding down the Shift button horizontally;
- Keys + and - used to scale the document;
- Ctrl + Z and Ctrl + Shift + Z used to undo and redo recent actions, respectively;
- Shift- select several shapes.
The black rectangle in the center of your canvas is the drawing area, you can resize it through the menu "File" ->"Document Properties".

2. Creating shapes
As I said, all the actions for drawing an image are performed using various shapes. Select one of the available shapes on the left panel and click on the area of the workspace where you want to insert the shape. To resize it, drag the mouse pointer in the desired direction.

Each shape has two parameters that affect its appearance. These are fill and stroke. Fill defines the foreground color of the shape, and stroke defines the outline color. Stroke and fill are configured in a window that can be opened from the toolbar:

In the Inkscape palette, you can choose a general color for the shape, and in the fill docker, you can select a separate color for the fill and stroke. In addition to a uniform color, gradinals can be used.
3. Grouping objects
For the convenience of moving and applying objects, the vector editor Inkscape supports grouping them into groups. To do this, mark several objects using the Shift key and in the menu "An object" choose "Group"... Now all the selected objects are in one group, you can move them and apply operations to all of them at once. You can also use the keyboard shortcut for grouping Ctrl + G.

To ungroup, use the ungroup item. Or press the key several times Ctrl + U... In the question of how to use Inkscape, it is more important to work with shapes and colors of shapes, let's take a closer look at this.
4. Actions on shapes
To move the shape you need to use the tool "Arrow"... Also when the shape tool is activated, for example "Rectangle", you can change its size, angles and outlines using the white squares. Just drag them to the desired direction.

With a tool "Arrow" you can not only change the size, but also switch the foreground and background, reflect objects and fine-tune their coordinates. Please note that when you change the drawing tool, the toolbar changes, it displays the capabilities of this tool:

Tool "Edit Corners" allows you to change the angles and outlines of an object in various ways:

Tool "Adjust objects by painting or sculpting" allows you to change the color and shape of objects, for example, you can make them concave, move them in different directions, shrink and enlarge, rotate and even duplicate objects. To apply actions, the object must be selected.

Tool "Meter" allows you to change the lengths and angles of various geometric objects:

5. Filters
Filters can be used to apply various effects to objects. All available effects are sorted into categories and are available from the menu "Filters"... Effects include various textures, design changes, and much more:

6. Saving the result
Since in this article we set ourselves the task of teaching beginners about Inkscape, we will explain how to save an image. Since these are vector images, a special format will be used here - svg. To save the finished image, open the menu "File" and select "Save", then select the location of the file:

Vector graphics draws pictures, writing down the mathematical laws for constructing straight and curved lines from which the image is built. The recording is done in XML, so these images are actually text files.
Since the mathematical laws of constructing an image do not depend on its size, it becomes possible to scale vector images within a huge range without the slightest loss of quality.
Vector graphics have been around for a long time, but their heyday is ahead. With the onset of a new, sensory stage in the development of computer technology, the first representatives of which are tablets and communicators, there is an urgent need for scalable and lightweight graphic files.
Inkscape, being a free open source editor, works with the free vector file format - SVG (Scalable Vector Graphics). Nowadays, almost all gadgets and web browsers support the SVG format, and with the arrival of HTML 5, placing SVG files in web content will not be any more difficult than placing bitmap graphic files.
Mastering Inkscape today is an intelligent investment for tomorrow.
Inkscape versions and releases
As of this writing, the newest release of Inkscape is 0.48. It is available for Windows, Linux, Mac and other platforms.If you have an earlier version, don't dramatize this slight lag. Versions 0.46 and 0.47 of the program are very similar to 0.48 in their functionality, only a few very special effects have been added, and a new panel has also appeared Adhesion... So calmly work on the version that is at your disposal, with the next upgrade you will not lag behind life at all.
Inkscape 0.48 window structure
When you first start Inkscape, you will see a single window in front of you. But there are so many crammed into the frames of this window that you can sort it out for a long time. Figure 1 will help with this.Rice. 1
Let's start in numerical order:
1. Menu bar as in any program, everything is clear here.
2. Command bar... All commands of this panel are available from various menus. So this panel can be safely removed if you need a larger window.
3. The settings panel for the current instrument... When a certain tool is selected (in Figure 1, this is a tool "Draw stars and polygons"), then on Toolbars for the current instrument its settings appear. At the end of the panel there is a black triangle, which means that not all settings fit into the window. By clicking on it, you can view the missing settings.
4. Toolbar... Contains miniatures of 18 tools, with the help of which vector graphics are created. Any tool can also be called by pressing hot keys. The tooltip appears on hover with the mouse pointer. Right-clicking on an instrument opens its global settings window.
Panels 2, 3, 4 and 12 can be dragged with the mouse by the rectangular stripes, which are colored green in Figure 1, and are highlighted in the Inkscape window by two rows of faint points.
5. Palette... Color can be dragged with mouse Palettes to the object, changing by this action its Fill... To change the color Strokes, you need to hold down the key while dragging SHIFT... The current color of some tools can be set by clicking on the corresponding color Palettes... At the right end of the palette is a small triangular switch. Clicking on it opens the palette settings menu. You can customize the appearance of the palette, and choose from a variety of predefined palettes. If all the colors do not fit in the window, then under Palette a scroll bar appears.
6. Status bar... Contains five areas :
7. Fill and Stroke indicator for selected object... When there is a selected object in the window, Indicator colored with its fill and stroke colors. Left-clicking on a color opens a window Fill and Stroke, used to configure these parameters. With a right click - a menu with useful options drops out, which sometimes allows you to do without opening a window Fill and Stroke.
8. Layer Information Section... If there are few layers, then it is quite possible to get by with this section without opening a special window. Layers.
9. Notifications section... Displays helpful messages about current activities. You need to get in the habit of glancing at this section, especially when using an unfamiliar instrument or something that doesn't work. If the entire message does not fit into the section, then when you hover the mouse pointer, the text appears in full.
10. Mouse Pointer Coordinates.
11. Current scale indicator... You can enter the desired scale by hand and click ENTER, but you can use the arrows.
12. Sticking panel... This panel contains snapping controls (lines to objects, meshes, nodes, and so on).
The working area of the Inkscape window is called Canvas... There are rulers at the top and left of the canvas. When you hover the mouse pointer over the ruler, a tooltip will pop up, in which units it is graduated (by default - in pixels). The rulers can be dragged with the mouse to form Guides.
In the middle of the canvas, the frame of the new Document... Sometimes Document also called Page... If the linear dimensions of the document need to be changed, then you should go to the menu File ⇨ Document Properties.
You can draw anywhere on the canvas, even outside the document border.
Dialog boxes
Some menus open dialog boxes, for example: Fill & Stroke, Layers, Transforms and others. In Inkscape 0.48, these windows are docked to the right frame of the program window by default. In addition, they can be fastened together. This is sometimes not very convenient, as it greatly narrows the size of the working area of the window. With the mouse, you can move these windows and display them outside the main window. To globally disable the docking function of dialog boxes, you need to go to the menu File ⇨ Customize Inkscape ⇨ Windows ⇨ Dialog Behavior.Now that we’re familiar with the structure and parts of the workspace, we’ll start using them in the next chapter. In this case, we will use the "immersion" method, that is, we will immediately start creating vector images.
Chapter 2, in which the Swedish flag teaches us how to use nets, sticking, and more
The topic of today's lesson will be the flag of Sweden.
Along the way, we learn:
- How to calculate page sizes and grid spacing
- How to create a document of the right size
- How to create a grid with the desired line spacing
- What is sticking and how to use it
- How to work with the rectangle drawing tool
- How to combine paths
- How to change the fill and stroke colors of an object
- How to save a finished document and how to export it to a bitmap
We already know that vector graphics are a mathematical description of an image. Mathematics is an exact science, therefore, before getting down to business, you need to know exactly the size of the future document and its individual parts.
From Wikipedia, we learn that the flag of Sweden has an aspect ratio of 32 to 20, with the vertical stripe of the cross starting at 5/16 on the left and being 2/16 wide, and the horizontal stripe in the middle and equal in width to the vertical one.

So we need to choose the document size either 32x20 or 320x200 pixels. For vector graphics, this does not really matter, but for the sake of clarity, we will choose a larger page size.
Launch Inkscape and see the A4 size document that opens by default. Go to the menu File ⇨ New and in the impressive list of documents that has dropped out, we do not find the necessary one. It means you need to change the properties of the document.
Menu File ⇨ Document Properties(picture 1).

Rice. 1
The section we need is circled in red Other size, into which we enter the new dimensions of the document. (Button Resize page to fit content do not touch, since there is no content yet).
By clicking ENTER or moving the mouse pointer to the main window, we see a small rectangle at the bottom of the canvas. This is the correct size document. To enlarge it and place it in the center of the canvas, press the key 5 or the icon on the command bar.
While the window is open Document properties, it is useful to immediately set up a comfortable grid. What is a grid? Being connected to the menu View ⇨ Grid, she turns the canvas into a page of a school notebook in a box. We can only change the size of these cells.
Let's go to the tab Grids(Figure 2).

Rice. 2
While this tab is empty, as soon as we create a new grid, the default grid settings will appear (Figure 3).

Rice. 3
By default, grid line spacing is 1 pixel. It doesn't suit us, it's too shallow. We fill in 20 pixels in both X and Y. Why 20? Both 320 and 200 are divisible by 20. In width, exactly the sixteenth shares are obtained, which we need to construct the cross. It's easy to find the middle of the document in height, especially when the major grid lines are every 5 regular ones. Not a mesh, but convenience itself!

Rice. 4
The Swedish flag consists of only rectangles. It will be more convenient for us to draw rectangles if the lines go exactly along the cells of the grid - "stick" to it. Therefore, we will immediately configure adhesion on the appropriate tab (Figure 5).

Rice. 5
Let's open the tab Adhesion... In the section Sticking to meshes you need to turn on the radio button Always stick... This will mean that the nodes of the image will stick to the grid lines, no matter how far from them they are.
This is convenient in our case when the drawing consists of only rectangles. But this setting can be very difficult when drawing curves and ellipses!
Then on Sticking panels you need to connect the following miniatures: Sticking globally , Stick to knots or their levers, make sure the two Stick to Grid and Guides buttons are connected and make sure NOT connected Sticking to the corners of the pad .
At the end of all the settings, the window Document properties need to close.
It's time to start drawing. The first step is to draw the background of the flag.
We take a tool for drawing rectangles ( F4). On the canvas, its pointer is a small rectangle with a cross above the upper left corner. The cross is actually a pointer. Move the pointer over the upper left corner of the document, press and hold the left mouse button, move the pointer to the lower right corner of the page.
Thanks to sticking, the sides (or rather the nodes) of the rectangle exactly coincide with the borders of the document (or rather, with the grid lines). Without sticking, we would have to manually match the boundaries.
The color of the rectangle can be anything, I got red with a black stroke. Now it does not matter what color the fill of the rectangle is, we will change the color anyway, but the presence of a stroke is required, otherwise you will not see further actions. Therefore, if your rectangle does not have a stroke, then, without changing the tool, press the key SHIFT and click on the black square on Palette... A stroke will appear.

Rice. 6
Notice the small squares at the top left and bottom right corners of the rectangle. They serve to change its size. With the same tool F4 you can grab the square and drag to resize the rectangle.
But the circle in the upper right corner is for rounding the corners of the rectangle. You can learn more about rounding corners (and more) by reading the great interactive Inkscape Tutorial in Russian, which is on the menu Help ⇨ Tutorial... Highly recommend.
We could start now changing the background fill color to the blue we need, but that would be strategically wrong.
While we have the tool for drawing rectangles in our hands, we should immediately draw a cross. Move the pointer to the fifth grid line along the upper side of the document (just the main line will be), bring it down to the intersection of the seventh grid line with the lower side of the document (Figure 7).

Rice. 7
Now it’s clear why we wouldn’t have seen the results without the strokes!
Without postponing things indefinitely, draw a horizontal line of the cross.

Rice. eight
We could stop at this. When we change the background color to blue, the cross to yellow, and remove the stroke, the flag is ready. But since we are learning, we will carry each task to the end. So far, we do not have a cross, but the intersection of two rectangles. To turn it into a real cross, you need to merge the outlines of these rectangles.
We take the tool Allocations (F1) and with the key pressed SHIFT click on both rectangles of the cross in turn. They both become selected, as can be seen in the dotted stroke in Figure 9.

Rice. nine
Now you need to go to the menu Contours ⇨ Sum and fold the two paths.

Rice. ten
Now we have a real cross!
It remains to paint the document in the national colors of Sweden. The same Wikipedia reports that the blue color of the Swedish flag has a shade of Red: 0, Green: 90, Blue: 173 in the RGB system. To accurately reproduce this shade, we need a window Fill and stroke... First of all, you need to select the desired rectangle (background) using the tool F1, which we have already selected. To be sure, let's look at Notifications section on the bottom pane of the program window. The selected object will be described there: Rectangle on Layer1 .
Open window Fill and stroke in several ways: From the menu Object ⇨ Fill and stroke; right click on the object and open the line Fill and stroke; click on thumbnail on Command Panels(although it is not always visible due to the size of the window); hot keys Shift + Ctrl + F(does not work everywhere). One way or another, we open this window (Figure 11).

Rice. eleven
In the tab Fill the Flat color button is already pressed, we need to set the RGB values we know. They can simply be entered into the corresponding windows, or set them with arrows, you can move the sliders on the scales, you can even enter the hexadecimal color number in the window RGBA... The A scale means the fill is transparent, full opacity is 255, full transparency is zero.
The background changes colors before our eyes and takes on the desired shade.
Go to the tab Outline and press the cross NS which means No outline... We don't need it anymore.

Rice. 12
Now you need to select the cross (while in Notification sections a message will appear: 12-knot circuit ...) In the window Fill and stroke there will already be new parameters of the selected object. We need to set the color to yellow R: 255, G: 194, B: 0 at full opacity. Remove the stroke.

Rice. 13
Remove the grid ( View ⇨ Grid).
The flag is ready. You saw his drawing at the beginning of the chapter.
It remains to save it. But first, let's go to the menu File ⇨ Clear defs... What does it mean? Along the way, we used temporary colors that were not included in the final stroke, and so on. All of them are written somewhere in the XML text of our file, increasing its "weight". Of course, in today's case, this is not much, some bytes, but the habit of getting rid of ballast must be developed from the very beginning. After all, the trump card of vector graphics is the small size of SVG files.
Now, in the same menu File, click Save, a dialog box will open where you specify the file name, say swedish_flag.svg and the directory where to save it.
And in order to be able to use the picture in other graphics programs or place it on the Web, it should be exported in raster format. For this we go File ⇨ Export to Raster... A dialog will open, as in Figure 14.

Rice. fourteen
In part Exported area, Page and Drawing in this case are the same. Therefore, we enter the file name and click Export... (Then we look for the file everywhere, and we find it in the home directory). It is a little confusing that the export dialog does not close automatically after completing the procedure.
Today's lesson has come to an end, in the next chapter we will tackle a more complex matter.
Chapter 3, in which we will master the use of guides, learn how to group objects, learn how to draw stars and move them around the canvas to a precise point
The topic of today's lesson will again be the flag - this time the flag of the European Union. In the process of drawing it, we learn:
- How to use guides
- How to draw pentagrams
- How to group objects
- How to duplicate objects
- How to move objects
- How to position objects along the Z axis
The EU flag consists of 12 gold stars on a blue background.

Rice. 1
From the last lesson, we know how important it is to accurately calculate the details of the image based on accurate information about the depicted object. The aspect ratio of the Euroflag is 27:18, hence the dimensions of the document will be multiples of these values. Let's say 270x180 pixels.
Star color by system RGB: 255, 204, 0
Background color - RGB: 0, 51, 153
Flag stars are regular pentagons (pentagrams) with a large radius R1 equal to 1/18 of the height of the flag.
In a regular pentagonal star, the ratio of large and small radii is r2 / R1 = 0.382(Figure 2).

Rice. 2
This means that if we create a document with dimensions of 270x180 pixels, then the large radius of the star will be equal to 10 pixels. Create a grid with 10 px X and Y spacing, ensuring that the nodes stick to the grid lines and guides.
We create the document and the grid ourselves, using the knowledge gained in the last lesson.
Now you need to create Guiding intersecting exactly in the center of the document.
To create a horizontal guide, grab the top ruler (located directly above the canvas) with the mouse and drag it approximately to the middle of the document. The resulting thin line is called Guide... When you hover over it Highlighter (F1), it will change color to red. While it is red, double-click on it, and a dialog box will open Guide(Figure 3).

Rice. 3
Let's take a closer look at this dialog box:
- On the X-axis, enter the abscissa of the middle of the document: 270/2 = 135 pixels. This will expose the center of the guide (small circle) exactly in the middle of the page.
- Let's write 90 pixels (180/2) along the Y axis, so that the guideline will divide the document in height exactly in half.
- Angle (in degrees) we will leave it equal to zero, since we need a horizontal guide (if we set it to 90 °, we will get a vertical guide).
Now create a vertical guide. To do this, take the left ruler and drag it onto the canvas. You can also take another horizontal one and using the dialog box Guide give it a vertical orientation. In any case, it is important to center it on the X and Y axes.
As a result, we have two guides intersecting exactly in the center of the document. As in Figure 4.

Rice. 4
In Figure 4, I changed the color of the guides to green to distinguish them from the grid lines. This can be done in the menu: File ⇨ Document Properties ⇨ Guides.
From the intersection of the guides and start drawing the first star. Let's zoom in. This is done using the + key, or in the window Current scale indicator (Magnifier) on the bottom frame of the Inkscape window.
Let's take a tool Drawing stars(hot key "*"). On Tool Settings Panels select the star icon, the number of angles is 5 and the ratio of the radii is 0.382. (A list of all sorts of options drops out, among which there is a pentagram).
Start drawing from the point of intersection of the guides, and move the tool up to the point of intersection of the guide with the first line of the grid. If we've enabled snapping to grids and guides, it's pretty hard to go wrong. Since the distance between the grid lines is 10 pixels, the star will also have a large radius R1 equal to 10 pixels, or 1/18 of the flag's height (180/18 = 10). Remove the fill from the star and set the stroke to 0.25 pixels thick.

Rice. 5
We have a sample of the star. Now you need to arrange 12 stars according to the specification: around a circle with a radius of 1/3 of the flag height (180/3 = 60 pixels) and in the order of the numbers on the clock face. This task can be accomplished in several ways: you can draw a circle, divide it into 12 parts, and place a star at each of the 12 points; you can move copies of our star from the center of the document to points with calculated coordinates; you can think of other options.
We will take the simplest path.
First, let's set the scale to about 400%.
Then deselect the already drawn star. To do this, just click on any empty spot on the canvas.
Then we take the instrument again Drawing stars and polygons(hot key "*"). Draw a regular dodecagon from the point of intersection of the guides straight up. Its top corner should lie at the intersection of the vertical guideline and the sixth from the center of the grid line. The tool settings can be seen in Figure 6.

Rice. 6
To place stars on all twelve vertices of the polygon, you need to adjust the snapping differently. On Sticking panels disable sticking to Grids, Guides (their buttons usually do not fit in the window, to see them you need to click the black corner at the bottom of the panel)... But we connect visible buttons Snap with centers of objects and Stick to sharp knots(they are shown in Figure 7).
First, let's move the existing star to the top corresponding to 12 o'clock. Select the object with the tool Highlighter (F1) and drag them into place. We follow the hints that appear near the pointer (we need the middle point of the object to stick to the sharp node) as in Figure 7.

Rice. 7
We will make the second sprocket using the duplication method. When duplicating, a copy (duplicate) of the selected object appears, and is located exactly above the sample, so that the duplicate can only be detected by dragging it with the tool Highlighter (F1). Do not forget to cancel unnecessary movements later using hotkeys Ctrl + z or menu Edit ⇨ Undo.
Now let's duplicate the star. With the object selected, press the keys CTRL + d(you can select the menu Edit ⇨ Duplicate, or you can right-click on the object and select Duplicate from the pop-up menu). The duplicate is already selected and is placed on top of the original.
It remains to take it Highlighter (F1) and move to the next vertex (Figure 8).

Rice. eight
Continue duplicating and dragging until all 12 Euro-stars fit in a circle.
Select and delete (using the key Del) a dodecagon - we no longer need it.
Now select all the stars by clicking on them with the selection tool, while holding the key SHIFT, or draw with the tool Highlighter (F1) a square frame around all the stars as we select several icons on the desktop (the "eraser" method). All stars will be highlighted. Then we will group them (Object ⇨ Group)... Why group? To fill them with yellow and remove the stroke not one by one, but from all at once. And in general, you need to get used to the order.
Open the window Object ⇨ Fill and stroke and fill the group of stars with color RGB: 0, 51, 153 or, in other words, RGBA: fecc00ff.

Rice. nine
It remains to create the background. Connect sticking to Border of canvas (the button is not visible - click on the black corner at the bottom of the panel) .

Rice. ten
Use the tool to draw a rectangle over the entire Document, it will stick to the edges of the Page. Fill it with color RGB: 0, 51, 153 (003399ff).

Rice. eleven
Sorry, where are the stars? They stayed "below" under the background. Every image on a document is at its own level. Although we only have one layer, it still looks like layered. This is called positioning by Z axis(an imaginary axis perpendicular to the plane of the canvas). Adjust the position of the selected object by Z axis using the keys:
- HOME - raise to the topmost plan
- PgUp - raise
- PgDown - omit
- END - Send to Back
You can also do it from the menu An object(the same positions), or using the corresponding picograms on Selection tool dockers (F1).
We have two ways: either raise the stars to the very top, or lower the background to the very bottom. Since the background is easier to select, since it is in plain sight, select it and press the key PgDown... Here are the stars. (If we had not grouped the stars, we would have had to press the key PgDown twelve times, according to the number of stars, or use the key END.

Rice. 12
It remains to hide the guides and the grid. (View ⇨ Grid / Guides).
The flag is ready. Clear defs and save it. Export to raster format if desired PNG image.
That's all for today, and next time we will leave the children's games with flags and will come to grips with the contours.
Chapter 4 on paths, bezier curves and gradients.
Today we are going to portray a funny cross between an iron and a font. In doing so, we learn:
- How to import a bitmap
- How to make a vector outline of a bitmap
- How to work with paths and Bezier curves
- How to create text objects and turn them into paths
- How to fill an object with a gradient
Our today's image looks like this:

Rice. 1
To create it, we need at least an iron, or rather a photograph of it. Finding it on the Internet is not difficult. Here's what I used:

Rice. 2
Create a 500x500 px document, turn off snapping globally, we don't need a grid.
Now we take the image file and drag it with the mouse onto the canvas. Immediately we will see a not very clear dialog box (Figure 3).

Rice. 3
What does it mean? - There are two ways to mirror raster (non-vector) images in Inkscape.

For our purposes, the second option is suitable - To tie photo of the iron. We will still delete it later.
So, we have a photo of the iron on the canvas. This is called importing bitmaps. You can use the menu File ⇨ Import... There is no difference between these two methods.
Now we will outline the raster file with an outline. Inkscape has mechanisms to automatically vectorize bitmaps, but we don't need them right now. It is much faster, more reliable and more economical (in terms of file size) to circle the photo of the iron with a vector outline.
To do this, let's take a tool that responds to hotkeys. SHIFT + F6, and is intended to Draw Bézier curves and straight lines... What are Bezier curves, you look on the Internet, and working with them is very pleasant and interesting.
We increase the scale of percentages to 250, and begin to put points (nodes) with the tool SHIFT + F6... Place the first point with the left mouse click and drag the cobweb line to the next corner or change in curvature. The more nodes there are, the more difficult it is to create a nice outline later, and the larger the file size. However, the missing nodes can always be added, and the extra ones can be removed.
Scroll the canvas vertically with the mouse wheel, horizontally SHIFT + mouse wheel... Having reached the initial node along the contour, click on it, and the contour is closed.
To see the nodes as in Figure 5, you need to take the tool ( F2) and click on the outline.

Rice. 5
Then we further increase the scale and correct the unsuccessfully light points (simply by dragging them with the mouse), delete the extra ones by selecting them by clicking the mouse and pressing the key DEL... To add the missing node, you need to double-click the tool F2.
Then we begin to bend straight lines, turning them into Bezier curves. All this is done with the same tool. F2... You can bend by grasping the contour line and pulling with the mouse, or you can use the levers that appear at the nodes when the line is bent. The levers can be rotated and changed their length, allowing very precise fit of the contour to the image (Figure 6).

Rice. 6
Having processed the outer contour slowly, we process the contour inside the iron handle in the same way.
We need to combine both contours into one so that between the handle and the body of the iron we get a "hole" like a roll. To do this, select the outer and inner contours while holding down the key SHIFT... As in Figure 7.

Rice. 7
And then combine by going to the menu Outline ⇨ Combine... This is what the merged path looks like (Figure 8) after the raster photo has been removed. (To delete, you need to select it with the F1 tool, and then press the DEL)

Rice. eight
It's time to get busy with the text. We take the tool Text (F8) and make the necessary settings on the Tool Settings Panel. Font selected here Nimbus Roman # 9 L- it has big beautiful serifs, Font size: 144 and style Bold(Figure 9).
If you do not have a suitable font, then install it as usual in your operating system. Inkscape will find the system fonts the next time you start the program.
Somewhere under the iron we click the tool Text, and type the word "IRON" in capital letters. If you forgot to make the settings, then it's not too late, the text will change right before your eyes.

Rice. nine
Then select the text with the tool F1 and using the arrows around the dotted selection rectangle we adjust the size of the text block to the size of the iron outline and set it to the desired place.

Rice. ten
To be able to modify the text, you need to turn it into an outline. At the same time, it will lose the properties of the text (the ability to edit, a small "weight"), but it will acquire all the properties of the contours. This transformation is irreversible, there is no way to get the text back from the outlines (although you can undo this action).
So on the menu Paths ⇨ Outline Object... The selection frame becomes smaller, now it is close to the letters. And using the F2 tool, you can see the nodes of the new paths, as shown in Figure 11.

Rice. eleven
To make it easier to work with the outlines of the letters, remove the text fill and set the stroke to 1 pixel. Then, while holding down the SHIFT, tool F2 select all the top nodes in each letter. The selected nodes will turn blue, as in Figure 12. Then, using the up arrow on the keyboard, raise the selected nodes a certain distance.

Rice. 12
Everyone is good at drawing 12, but let the letters down Have and G- the extra nodes were not included in the selection. But this case is easily fixable. Let's look at the example of the letter G... First, select and delete the extra node that did not want to go up. The slanting bar will disappear. Then select together the top nodes of the letter that remain unconnected. Click on the icon Connect the contours along the selected end nodes with a new segment... This pictogram is located on Tool preferences panels directly above the canvas, and is clearly visible in Figure 13.

Rice. 13
The contour between the selected nodes will be closed. Let's do the same with the letter Have.
The question is, why didn't we just move the extra nodes into place? The fact is that in this case the contours of the letters Have and G would not be closed, and this could spoil a lot of blood for us during further image processing. Order is when all contours are closed.
Having corrected the contours, we will continue to lift the upper row of nodes. To do this, you will have to select all of them again, but now the space allows you not to click on each, but, with the same tool F2, circle all points with a long rectangle, as we select a group of files on the desktop (the so-called "eraser method").
Let's raise the nodes so that they all are inside the contour of the iron, and the ring of the letter NS pull it out separately by hand, as high as possible and slightly to the right, without going beyond the contour of the iron.

Rice. fourteen
What's next? That's right, the contours need to be combined, and not just combined, but summed up in order to exclude all unnecessary parts of the text inside the iron contour. Select both paths. Come on Contours ⇨ Sum... And before us is the sum of two contours (Figure 15).

Rice. 15
Now it remains to fill the merged path with a gradient.
A gradient is a fill in which one color blends into another. We want a smooth transition from black to red. Open the window Fill and stroke and in the tab Fill click the icon Linear Gradient(Figure 16).

Rice. 16
Note that in the column Repeat we choose from the list Reflected... This means that the color change will not just go from black to red, but will be mirrored and go from red back to black.
But as long as we have a gradient from black to transparent, although you may have another, it doesn't suit us, we press the key Change and a window appears Gradient editor(Figure 17).

Rice. 17
In the window Gradient editor at the very top, a narrow strip (partially hidden in Figure 17) shows the current gradient. Below is the section of the anchor points of the gradient (the mouse pointer rests on it). We should have two anchor points: black and red. Clicking with the mouse anywhere in the section (and not only on the arrows at its right end) brings up a list of anchor points (in Fig. 17 this is stop3794 and stop3796).
Use the mouse to highlight the first anchor point with blue. The black anchor point should be RGB black: 0,0,0 at a full opacity of 255.
Highlight the second anchor point with blue and set its color to red RGB: 255,0,0, as in Figure 17. Opacity 255 (pay special attention to the opacity scale A - they often forget about it, and then wonder why the gradient is transparent).
Let's go to the main window, and take the tool ( F2). We see the following picture (Figure 18).

Rice. eighteen
We got a gradient going from black to red from right to left. And we need from top to bottom, and even with reflection.
See the gradient lever I marked with the black arrow in Figure 18? It is visible only with the help of the tool F2... The left end of the lever has a square (first anchor point), and the right end has a circle (second anchor point of the gradient). For this square with a circle, the gradient lever can be dragged, expanded, lengthened and shortened as you like. By dragging the square to the handle area, and the circle to the middle of the iron, we get what we want (Figure 19).

Rice. 19
I moved the gradient lever in Figure 19 outside the outline for better clarity. Please note that the lever is not strictly vertical, but slightly tilted so that the red line runs parallel to the sole of the iron.
Now it remains to click with the tool somewhere outside the contour and all the nodes and levers will disappear.
We clear defs.
We save the file in our archive. The work has been completed.
In the next chapter, we will take a look at the automatic bitmap vectorization program built into Inkscape.
Chapter 5, in which we will learn about automatic vectoring of bitmaps
Today we will very briefly take a look at the automatic bitmap vectorization program built into Inkscape. Superficially - because this topic is inexhaustible, it depends entirely on the nature of the bitmap, as well as on the experience of the vectorizer.
We will hardly touch upon the issues of manual outlines, this topic is discussed in some detail in the article "Inkscape: Continuing the development of a free vector graphics editor", as well as in this Guide.
The topic of the lesson will be automatic vectorization using the built-in program in Inkscape. .
First, we need to clearly explain that no program for automatic conversion of a raster image into a vector will give us a vector copy of our favorite photo or painting. All such programs can only help to build the contours of the image for further manual processing.
The first step is to import the bitmap into Inkscape. The easiest way to do this is by dragging and dropping the file into the program window.
Then go to the menu Paths ⇨ Vectorize Raster... The window shown in Figure 1 will appear.

Rice. 1
There are three areas in this window:
Single scan(meaning one-shot) - marked in green.
Multiple scan(scans several times, the number of scans is indicated in the box). The results of these scans are stacked along the Z-axis.
Preview... In this area, after pressing the key Refresh a preliminary processing result appears.
The choice of the scanning method is carried out by clicking on one of the radio buttons, regardless of which area it belongs to. Only one button can be selected at a time; if this method is possible, then in the area Preview an image will appear.
If you are satisfied with the preview result, click the button OK by starting the vectorization process itself. With large raster files, it can take quite a lot of time.
What process should be used in each specific case? This can only be shown by experiment. Try different methods, with different thresholds, try single and multiple scans, don't forget the tab Options.
Here are some examples to illustrate the process.
1. Simple color hand-drawn image with text.

Fig. 2
In Figure 2, you can see the original logo. The drawing is very simple, the text is standard, there are few colors. Only the ball itself is depicted in great detail, it looks like a photograph is inserted. The best way to vectorize such an image is to use multiple scanning in color... Moreover, if you take a large number of colors, for example 32, then the result will be very similar to the original without any additional processing, shown in Figure 3.

Rice. 3
As the saying goes, find five differences.
One thing is bad, this SVG file "weighs" almost 4 megabytes! After all, this image is a stack of 32 separate outlines of different colors. Files of this size are useless.
You can get good contours by reducing the number of colors at multiple scans in color up to four. Figure 4 shows the original itself (in the top row) and four multi-colored outlines.

Rice. 4
They were "pulled" out of the pile and placed side by side. In this case, the green outline is the most successful, it is quite possible to break it ( Outline ⇨ Split) on separate paths, then give each part an appropriate fill and stroke, and you will get a small in weight and very high quality vector copy. At the same time, the share of manual labor is minimal.
2. Simple hand drawn emblem
Take, for example, a simple one-color Adidas logo (Figure 5, above).

Rice. 5
To vectorize it, I used a single scan with edge detection. All settings were left by default. The result is a nice outline suitable for filling and stroking. And if you tweak it a little by hand, removing unnecessary nodes and straightening some Bezier curves, and even re-drawing the ® trademark, you will get a logo that is better in quality than the original sample.
3. Enlarged photo fragment
The logo below is a highly enlarged section of a photograph of a train carriage.

Rice. 6
It was vectorized in two stages. First, a single scan was applied with By reducing the brightness at doorstep 0.150. The result is the top contour in Figure 7.

Rice. 7
The symbol of the monads - Yang and Yin is perfectly visible on it, but the font did not work out at all. Then the threshold was increased to 0.650 and the contour in the middle of Figure 7 came out.
We worked with him a little by hand, the circles were drawn with a tool For drawing circles and ellipses (F5), Red Yang was slightly corrected, and got the logo on a solid "four". (Below in Figure 7). If I still had to correct the letters, it would have been better than the firm's.
4. Medium complexity image with poor quality photo.
We managed to download a picture, familiar to our fathers with pain in the lungs, from Kazbek's cigarettes (Figure 8).

Rice. eight
The photo, as you can see, is of poor quality, taken from a wrinkled pack of cigarettes. However, it was possible to create a quite decent logo from it, and manual processing was required only in part of the font (Figure 9).

Rice. nine
Multiple scanning was applied at 6 colors. Results with an exploded stack of contours in Figure 10.

Rice. ten
Out of 6 contours, 3 were selected (Figure 11).

Rice. eleven
The blue outline gave the silhouette of the mountains and the rider (with minimal manual processing - cleaning the spots) and the font (with a thorough manual correction of the outline of the letters). Everything was removed from the middle contour, except for the snow caps (the nodes were removed manually using the "rubber band" method). Well, the background (bottom) remained the background.
Hope these few examples give you an idea of the automatic vectorization process in Inkscape. There is quite a lot of literature on this topic and there are good examples. But in such a case, nothing can replace personal experience - try different modes, be creative and dare, but remember that our main tool is the head and hands.
In the next chapter, we will deal with the depiction of volumetric objects: cubes and boxes.
Inkscape (Inkscape) is a powerful editor for creating vector graphics, artistic and technical illustrations of almost any complexity.


Inkscape designed to create presentations, logos, business cards, posters, illustrations for office circulars, technical illustrations (diagrams, graphs) and much more ...


V Inkscape it is possible to create vector graphics for high quality printing (with pre-import SVG in Scribus), web graphics (from banners to website layouts), pictograms for applications, buttons for sites and graphics for games.


The history of Inkscape began when several programmers and a couple of designers who could write code were no longer satisfied with the conditions for developing a vector graphics editor. Realizing that they would not be able to properly apply their skills, they organized a new project, which they called Inkscape.


V Inkscape own rendering engine is used livarot (in the future, it is possible to switch to Cairo), has a powerful scripting infrastructure (written in Perl, Python and Ruby). SVG based on markup language XML and extensions are written to it, for example, implementing support for new data formats.

Inkscape uses the standard W3C entitled Scalable Vector Graphics (SVG). Format SVG allows you to create illustrations of various types, including animated ones.

Inkscape has its own document format (based on SVG v1.1), immediately contains a number of extensions to increase functionality.

The documents Inkscape SVG can be saved as Plain SVG with the ability to modify not supported in the usual SVG elements as outlines. Documents can be saved and opened in a compressed form using a compression algorithm gzip.

V Inkscape such capabilities are supported SVG like shapes, paths, text, markers, clones, alpha, transforms, gradients, textures and grouping. Groups can be used SVG as layers and moving documents between layers.

Inkscape also supports metadata Creative Commons, editing of nodes, layers, complex operations with contours, vectorization of bitmap graphics, text along the contour, text wrapped in a shape, editing XML-data directly and much more.

Inkscape is easy to use and has familiar tools: Select, Scale, Edit Nodes, Rectangle, Ellipse, Star, Spiral, Freehand Line, Bézier Curves, Calligraphic Pen, Text, Connectors, Gradient, Eyedropper.

The contour-changing modes of the Concealer tool allow you to push, cut, grow, push, pull, and roughen any contour to arbitrarily reshape objects.

The way the color-changing modes of the new Corrector tool work is similar to how the soft brush works in bitmap editors. If you have multiple objects in your drawing, you can select them all and draw on them with any fill or stroke color.

Inkscape has a convenient contextual toolbar, comes with a set of textures available through the dialog “ Fill and stroke» (you can easily and easily fill the object with a texture in the form of stripes, checkerboard cells or a polka dot pattern).

Tool " Fill and stroke"Has great capabilities, works exactly the same as its counterpart in raster graphics editors, clicking on an area fills it with the selected color, allowing you to complete the task much faster.

With a dynamic effect " Circuit"along the path, you can direct one path along the other. With the usual node editing tool, path A can be edited directly on the canvas, and the result will be updated on the fly (the function is equivalent to "vector brushes" and "skeletal strokes" in other vector graphics editors).

The calligraphic pen has functions that allow you to use Inkscape to imitate woodcuts, which allows you to change the darkness of the strokes at any point and even erase parts of the drawing. It is possible to use " clones"and style inserts (assigning fill and stroke properties from one object to another).

Inkscape has a built-in bitmap vectorizer using SIOX to highlight objects in the foreground. Advanced options for working with clones of objects, creating a pattern from clones using any of 17 symmetry groups, support for tilt and pressure of the stylus when using graphic tablets (Calligraphic pen tool).

Inkscape supports shared drawing via protocol XMPP (Jabber), there is a built-in editor XML-code of a document with a tree of objects (to access document parameters not yet supported in the graphical interface).

Inkscape imports files in formats such as: SVG, SVGZ, EMF, EPS, PostScript, Dia, AI, Sketch, PNG, TIFF, JPEG, XPM, GIF, BMP, WMF, WPG, GGR, ANI, ICO, CUR, PCX, PNM, RAS, TGA, WBMP, XBM, XPM.
One of the main uses of vector graphics today is to create miniatures, or as they are often called, "icons". For the Russian Orthodox ear, such a word sounds a little blasphemous, I will not use it.When you create a miniature in a traditional bitmap form, you can reduce it (as well as increase) only within narrow limits, very soon it becomes impossible to understand what is actually depicted. After all, a raster image consists of individual dots (or rather, squares), called pixels, which have well-defined dimensions (1/90 of an inch, as a rule). By reducing the image, we are not reducing the size of the pixels, but their number, which makes the image details disappear. At high magnification, we see squares, but we do not see pictures behind them (as in a museum, with your nose buried in the canvas, you will see only strokes).
A vector image is another matter. It is essentially an XML text file and describes mathematically all the lines, curves and colors from which the picture is constructed. It is clear that when you change the scale, the laws for constructing curves do not change, so you can create a picture, and then enlarge and reduce it within huge limits without the slightest loss of image quality.
Unfortunately, there are no uniform standards for vector files yet, just as there is no way to view them without special programs. In the free software world, the SVG file is the standard, but still not all browsers understand it (you know which one). Therefore, you have to reduce the image to the desired size, and then convert it to a raster of the appropriate size. But in the new KDE 4, all graphics are vector, which is why it looks much better than the previous one.
Now let's get down to business. Let's start by drawing a vector light bulb and using it to shed some light on how to work with the wonderful, but not the most intuitive program Inkscape.
We create a new file. File -> New≈ the longest list of options opens. We choose from it icon_48x48, this is a common standard for thumbnails. We could create a file of any size and then shrink it, but why unnecessary movement?
Here we have an Inkscape window with a new blank file.
Rice. 1
Before you can draw anything, you need to do two things:
First. Pass the File -> Document Properties, a window of the same name with several tabs will open. We need a tab Adhesion(Figure 2).

Rice. 2
It is required to uncheck the box marked with a marker, thereby disabling sticking. When dealing with delicate work, adhesion gets in the way.
Second. Adjust the grid for easy drawing. My long agony with adjusting the grid showed that you need to adjust it at high magnifications, of the order of 10,000%, otherwise you can adjust it only by accident.
To configure in the same window Document properties open the tab Grids(picture 3)

Rice. 3
At the top of the window we read: Rectangular grid and beyond Create... We press.
The default grid opens, which doesn't suit us. We have a 48x48 pixel file, so the number of main gridlines should be a multiple of 12, 6, or 4 to easily see the middle of the canvas. Therefore, we expose The main grid line is each: 12 lines. A X and Y spacing leave 1 pixel. Adjust the colors of the regular and main grid lines so that it looks like graph paper (who remembers what it is). If the grid does not appear immediately, or does not appear as it should, then at the bottom of the window there is a long key Delete... After deleting the failed mesh, you should zoom in further and create a new mesh. The easiest way to change the scale is with the keys. + and - , or it can be in the very bottom right corner of the main Inkscape window, there is a special window (marked with an arrow in Figure 1).
Once the grid is created, it can be removed and overlaid from the menu. View -> Grid... It would be nice to save the file under the name lamp.svg so that the program will remember the current mesh. In general, in the course of work, I recommend saving the file from time to time. The fact is that Inkscape uses a limited amount of machine memory, and sometimes hitch caused by its lack of memory becomes noticeable.
Now let's start drawing. Choose a scale that allows you to see the entire canvas as a whole. Draw a circle closer to the top of the canvas using the tool F5.
Toolbar occupies the left border of the Inkscape window and any tool can be invoked by pressing a key Fn, where n is the ordinal number of the tool, starting from the top. You can just click on the pink ball, you can easily guess that it draws circles. Rather, it draws ellipses, but if you hold down the key CTRL then circles.
Before trying to draw a circle, be sure to go to the menu Help -> Tutorial -> Shapes... You won't regret it - the Inkscape tutorial is interactive. Right in the tutorial window that opens, you can practice drawing, changing, transforming shapes and other elements. All this is accompanied by detailed instructions in Russian. You will never discover even a tenth of the program's capabilities on your own if you neglect Textbook.
But then you started drawing a circle and, out of relief, you drop the mouse - your circle turns out to be red with a thick black border, and even, perhaps, with a cut out segment.

Rice. 4
The tutorial did not warn about this. Don't rush to delete the scary circle and look for instrument settings. This is because Inkscape first draws an element and then changes it. This is somewhat unusual, since in most programs, and just in life, the instrument is first set up, and only then used. Here everything is the other way around: while there is no object, there are no settings (it was the same with the grid - first we created it, and then adjusted it).
The drawn circle is selected by default, but if not, then you need to select it using the tool F1≈ arrows. Take the time to read the first two sections of the tutorial, otherwise I'll have to rewrite them in this article. When the object (circle) is selected, you can easily turn the monster into a beauty. Let's start with the lost segment. Look at the panel above the working window: in Figure 4 I have outlined the segment of interest in green (it is visible only when the F5 tool is selected).
There are three options for drawing ellipses, for some reason, segmented is selected by default. Switch to the third (last) option and the circle will be complete. Good; now let's do the flowers.
Let's go with the menu Object -> Fill and Stroke... If an object is selected, you can easily change its shape and colors. Let's start with the red circle. Go to the tab Fill(Figure 5).

Rice. 5
We can see that now the flat fill of the color ff0000 (pure red) is selected according to the RGB system with an opacity of 100% (two additional hexadecimal digits ff at the end of the number). The number itself is inscribed in a window marked with a blue arrow.
For our purposes, we do not need the fill yet, so we click on the cross (green arrow), which means No fill... And the red circle disappears instantly.
Finally we have a black circle with a 1px stroke, as you can see if you look at the tab. Stroke style the same window. You may recall that we were going to draw a miniature of a light bulb and get down to business.
Now we have to make a pear out of the circle, so feel free to take the tool Shift + F6 which is called Draw Bézier curves and straight lines... You will find out on your own what Bézier curves are, but using them is very simple: press the left mouse button ≈ put a point, move the tool to another place, click, put a point. When we want to stop and not put more points, we double-click or press ENTER... The main thing in this business is minimalism - do not put more points than necessary, in extreme cases you can always add them. (However, removing unnecessary ones is also not difficult). As soon as we pressed ENTER how the hairline trailing behind the tool turns into a path with the current stroke (Figure 6).

Rice. 6
Now we take the tool F2 and start editing the nodes of the path and the paths themselves, turning them into Bezier curves. Here you need to practice a little, fill your hand and read Textbook, chapter Advanced course... Without this reading, you will never know all the secrets to dealing with Bezier curves.
You should end up with something similar to Figure 7.

Rice. 7
The next step is to remove the unnecessary lower part of the circle. To do this, you first need to combine two contours - a circle and a new curve - into one contour. To do this, hold down the key SHIFT, alternately click the tool F2 on a circle and on a curve. Then go to the menu Paths -> Merge... It turns out as in Figure 8.

Rice. eight
Notice the two nodes marked in red on the outline. Now we have to add one more node above each of them. This is done by double-clicking the tool. F2... The result is in Figure 9.

Rice. nine
Now you need to select the very bottom node on the circle with the same tool and delete it using the key DEL... This will slightly change the outline of the contour.
Then, with the key pressed SHIFT select two nodes, which are shown in yellow in Figure 10. After you select them, they also turn yellow.

Rice. ten
Then look up at the panel above the work window and find the icon Split path shown in Figure 11.
Rice. eleven
Click on the icon with the mouse and the outline between the selected nodes will disappear. Highlight while holding the key SHIFT, nodes at the fracture boundary, as shown in Figure 12.

Rice. 12
Using the pictogram Connect contours at selected end nodes(third from the left in Figure 11) connect the gap. Then do the same operation on the other side of the pear.
The bulb of our future lamp is ready. Now is the time to change her black color to a more suitable one.
Select the object with the tool F1 and open the window Object -> Fill and Stroke... In the tab Outline choose a linear gradient (Figure 13).

Rice. 13
The object is painted in some kind of gradient, but it doesn't suit us. Therefore, we press the key Change... A window will open Gradient editor, Figure 14.

Rice. fourteen
The Gradient Editor lets you change the colors of the gradient endpoints, which are called stop 3153 and stop 3155(numbers can be any). You can call them by clicking on the pointers, which I have marked with a green circle. After highlighting the top endpoint, you need to set it the desired color. This can be done in five ways: either using one of the four tabs that the blue arrow points to, or simply by writing the desired hexadecimal number in the box that I circled in red. I chose the color 729fcfff. The first six digits are red, green and blue numbers, the last (ff) indicates full opacity.
Then we go to the second endpoint of the gradient and assign a color to it, in my case it's 3465a4ff. The left part of the pear outline becomes lighter than the right one, and these colors smoothly blend into each other. This is the gradient. Take the F2 tool and a direction line (lever) of the gradient appears on the screen. Now it is horizontal, at the left end there is a square, at the right - a circle. With the mouse, move the square up and the circle down, as shown in Figure 15.

Rice. 15
The gradient will follow the diagonal of the canvas, giving a luminous effect to the top of the lamp.
Now let's start filling our flask. In the same window Fill and stroke, go to the tab Fill and choose Radial gradient... I used colors for the end points: ffffff56 and 729fcfe3. Pay attention to the last two digits in these numbers. This is no longer ff, which means that these colors have some transparency, which will give the flask a glassy appearance.

Rice. 16
The next step is to select our flask with the tool F1, and duplicate it. It can be done Edit -> Duplicate or, more simply, a keyboard shortcut CTRL + d... Duplication creates a copy of the object and places it right on top of it, so that the changes are almost invisible, except that the glass fill has become less transparent. Instead of duplicating, you could copy the object CTRL + c and then paste in the same place Edit -> Paste in Place (CTRL + ALT + v).
The top take of our flask is already selected, if you haven't deselected. Open the window Object -> Fill and Stroke... First of all, remove the fill completely by clicking on the cross NS in the tab Fill(Figure 5). Then by going to the tab Outline choose flat color ffffffff. It is not hard to understand that it is white. It completely overlaps the underlying blue color of the main pear.
Now grab the corner arrow of the selection frame with the mouse and, while holding down the key SHIFT, which will ensure proportionality, begin to reduce the white stroke. When it is inside the blue one, we will fit it closer to the blue outline using the tool F2 as in Figure 17.

Rice. 17
Now we need to give the white stroke a different color. We choose Linear Gradient... The one that will be open by default (from white to transparent) will suit us just fine. Install Opacity about 75% (scale at the bottom of the window Fill and stroke). All that remains is to set the gradient levers ( F2) as shown in Figure 18.

Rice. eighteen
The lamp bulb is ready. It was the turn of the "stuffing" - all kinds of wires, spirals and other things.
First, draw two wires holding the spiral. Stroke them with a linear gradient from dark 9927aff to white ffffffff. It is clear that the white end is the upper one, where the wires are heated with a spiral (Figure 19).

Rice. 19
Then we draw the spiral itself. Putting four points with a tool SHIFT + F6 and bend the Bezier curves. Paint the stroke white. (Figure 20).

Rice. twenty
It's okay that the spiral is still poorly visible, later it will manifest itself.
Now we draw a glass plinth that holds the entire structure. Draw a three-sided rectangle and bend its top side. Stroke color: flat d0bfacff; Fill: linear, from white ffffffff to white transparent ffffff00. Opacity about 50% - glass, after all. Also find in the window Fill and stroke string Repeat: and select Reflected... This will give a kind of double gradient from the edges to the center. Move the gradient levers slightly, as shown in Figure 21.

Rice. 21
Next, you need to give the bulb a yellowish tint, so characteristic of incandescent lamps. To do this, select with the tool F1 the outer blue outline of our drawing. Duplicate it. Then remove the stroke and fill it with ffc803ff flat color (Figure 22).

Rice. 22
After that, give the object an opacity of 25% and lower it to the very bottom of the drawing. This can be done from the menu Object -> Send to Back, or simply by pressing the key END.
Farther. There are always reflections on round objects. Draw a white oval with no stroke at 36% opacity. Then, a second time click on it with the tool F1... The arrows at the corners will change, now they invite you to rotate the object, which we will do. Then we put the oval in place, as shown in Figure 23.

Rice. 23
It remains to attach a base to the lamp. Draw a rectangle with the tool SHIFT + F6 and bend its upper and lower sides (Figure 24).

Rice. 24
Add an auxiliary layer below the current layer ( Layer -> Add Layer). On this new layer, paint with a 0.2 dashed stroke ( Stroke Style -> Dotted) the following zigzags, which will help us to correctly place additional points (Figure 25).

Rice. 25
Now we go to the main layer, and, focusing on the dotted zigzags, place on the sides with the tool F2(double click) two additional points. Then, with the same tool, move the new points a little deeper, and turn the contour segments between them into Bezier curves. The result should look like in Figure 26.

Rice. 26
Remove the auxiliary layer ( Layer -> Delete)... Just look at which layer you are deleting. You need to look either on the panel at the very bottom of the main window, or in the window Layers which can be called from the menu Layer -> Layers ...
Now we change the colors of the base. Stroke with flat color d59600ff and fill with linear gradient ffd543ff / ffeca9ff. We also apply Repeat: Reflected... After that, we lower the object to the very background ( END).
It remains to draw a thread on the base. Let's use the tool again SHIFT + F6 and draw the thread as in Figure 27. Remove the stroke and fill the background with d59600ff. In this case, it is enough to draw one object, and then copy and paste it in the desired place.

Rice. 27
Now we will make the lamp contact sole. To do this, just put two points, then bend them into an arc and paint the stroke with the color 5a5249ff.

Rice. 28
After that, we lower the object down ( END).
It remains to "put a shadow on the fence". Draw a black ellipse with no stroke, blur it at 5% and opacity at 15%. Then we lower it below ( PgDown or END).
The light bulb is ready. We remove the grid to make it easier to admire.

Rice. 29
But that is not all. Our drawing consists of many different objects, which are best combined so that they behave as a whole, for example, when scaling. To do this, you need to select everything (from the menu Edit), or simply circle the drawing with a rectangular frame using the tool F1... Then go to the menu Object -> Group, and instead of many separate frames, one large frame appears.
Save the file in SVG format for the archive. There are several possibilities further. You can export an image to a bitmap using the menu File -> Export to Raster.
If you need a miniature of a different size, say 16x16, then you need to go File -> Document Properties and there select a new document size ( icon_16x16). Then scale the drawing to fit on the new canvas and save as a copy. You can scale with the tool F1, arrows and keys SHIFT; but it's better to go to the menu Object -> Transform... Then in the tab Scale select a new size as a percentage, check the box next to Proportional scaling and press Apply.
When magnified, for example, ten times, it is better to first scale the object by 1000% and then resize to Object properties the size of the canvas (document). Otherwise, it can be difficult to find a tiny drawing on a large canvas.
That's it for the first time. In the next part, we will continue to explore the techniques for drawing vector graphics.
mikhaylovns December 9, 2016 at 02:53 PM
Inkscape: the beginning (translation)
- Working with vector graphics,
- Graphic design
- Recovery Mode
Translator's Preface:
In the first months of 2013, the authors of PCLinuxOS Magazine (licensed under CC-BY-NC-SA 3.0) focused on Windows migration, a GIMP tutorial, several PC games, and other topics. An article about Inkscape appeared in the March issue. It was named Inkscape: Getting Started from its author Meemaw. Basically, that's it. Following this line is the result of my attempted translation of this article.
We've been happily creating peculiar things with GIMP, but we shouldn't forget that GIMP is not the only graphics editor. The main purpose of GIMP is photo processing. Inkscape is a great drawing program.
While this sounds intimidating, it is actually not that difficult to draw with Inkscape. Practicing practice will help you draw some really good drawings. I was able to draw much more in Inkscape than with pencil and pen. I am far from being an artist, but with an assistant like Inkscape a lot of things work out much better.
Let's take a look around the main window of Inkscape and take a close look at it.
The first time you open Inkscape, you get the window shown in the following figure.
It already has a new document open, and rulers along the top and down the left side. You can change this view to show or hide as many tools as you want.
At the top we see a menu bar with the options File, Edit, View, Layer, Object, Path, Filters, Extensions and Help. Many of the menu items are available from elsewhere, and we'll see that soon.
Below the menu bar is the toolbar, which contains a significant portion of the most commonly used tools. At the beginning of work, it has the first eleven of the following elements: New Document, Open, Save, Print, Import, Export, Redo, Redo, Copy, Cut and Paste.
The rest of the tools serve in conjunction with the tools on the left side of the window, or help you navigate from one part of the project to another, and need some explanation.
The next three elements look like magnifying glasses with inner rectangles. These are scaling tools: from left to right, scaling goes to the size of the window of the selected part of the image, picture and page. They help you conveniently zoom in and out to the entire page and whatever selection you are working on. These commands are also available from the menu bar under the View → Zoom submenu.
To the left of them there are three elements that look like overlapping sheets of paper, the first of which is empty, on the second there is an image of a closed lock, and on the third is an open lock. These are tools for duplicating and cloning a selected object, used in cases where you need more than one of the same object (for example, many stars or flowers), as well as to remove the link between the clone and the original. By duplicating an individual object and making a specific change to it, you can only change the original. When cloning, if you make changes to the original, they also happen to the clone. This comes in very handy when you need two exactly the same objects, with the exception of color, for example. If you are cloning an object, you can change it and break the link between the clone and the original using the third mouse button, and then change the color of one of them. These tools are also available from the menu bar under the Edit → Duplicate or Edit → Clone submenu.
The group of the next two elements includes a circle and a rectangle surrounded by black dots. The left tool is used to group selected objects, and the right tool is used to ungroup them. As you paint safely, at times you will want to group multiple objects to complete your project. These buttons are very handy for doing this, as well as for ungrouping if you suddenly find out you need to fix something. These tools are also available from the menu bar under Object → Group and Object → Ungroup.
The last seven tools are arguably the most used in this toolbar. From left to right, in order, are the Fill and Stroke, Text and Font, Layers, XML Editor, Align and Arrange, Inkscape Options, and Document Properties. Let's take a look at the individual windows that open when you click on each of these tools.
Fill and stroke. With this tool, you paint over most of the objects and their borders. If I draw a rectangle, the Stroke is the color of its border and the fill is the inner color of the rectangle. I can change the inner color by selecting the Fill tab and choosing a color, gradient or pattern. I can change the color of the border by selecting the Stroke tab and choosing a color, gradient or pattern. In the next example, I drew a rectangle, painted it blue and made a black border, then chose Stroke Style and set it to 5px thick. Using the Fill and Stroke dialog, you can apply numerous options for fills and strokes. You can open it from the menu bar using the Object → Fill & Stroke submenu.

Text and font. Whenever you freeze some text in your drawing, you use this tool, because with it you change the font settings for your text. This tool works in conjunction with the Text tool on the left side of the window. You select the Text tool on the left side of the window, then type whatever text you want and open this tool (located at the top, center) to customize the text you have written, or even change it. The menu bar has a Text submenu that contains this tool.

Layers. As with many other programs such as LibreOffice Draw, Scribus and GIMP, layers are very useful when creating your project. You can create your picture on one layer, your background picture on another layer, and put your text on a third layer. It helps keep things in order and also helps you keep things still that you don't need to move. If you are confident with your background, you can put it on the bottom layer and lock it, and you will not be able to move your background anymore until you unlock it again. This mechanism allows you to freely deal with other objects. The Layers tool is also available from the Layers submenu. Here are the same buttons as we saw in the Gimp: clicking on the eye hides the layer, and clicking on the closed lock locks the layer and makes it impossible to change anything on it.

XML editor. Every drawing you make in Inkscape has a text description that is saved in the drawing file in .svg format. Each object that you insert into a drawing has a specific name and is listed in this text file. Clicking on its name gives you a complete list of that object's parameters (size, color, position on the page, etc.). The more complex objects you use, the larger you get the size of this file. Although I never do that, it is possible to change the picture by modifying this file. I tried to do this by duplicating the entity in the XML file, which was the circle I had drawn. I got two identical circles. If you understand this well enough, perhaps you can draw the whole drawing like that. This tool is also available through the menu item Edit → XML Editor.

Align and arrange. If you want to form a page with a specific object in its center, grab this tool. It is also found in the Object submenu. When you click on an object, you can click any of the buttons to align and center it. You can center the two selected objects, align along their borders, or spread them across the page.

Inkscape options. This is a quick, convenient and affordable way to open the options window. You can also open it using a command from the File menu.

Document properties. Every document you create is different. This tool gives you the ability to change document properties, orientation settings, padding, page size, include guides and grids. This tool is also available on the File menu.

If you don't know yet, every time you move the mouse cursor over a tool, a tooltip appears with its description and a hotkey for that tool. So if you hover your mouse cursor over the Fill and Stroke tool, the hotkey is Shift + CTRL + F. So you have three ways to get this tool. Use whichever is most natural for you. By the way, the last action can be canceled using the Edit → Undo menu item or CTRL + Z, as in other programs.
Now let's take a look at the left side of the window.
There are extensive tools here that you can use to do whatever you want. Also in the form of the third toolbar, changes occur depending on which of these tools you are using. The tools are as follows:
Selection tool. This is the arrow that we all know well. She selects an object with one simple click. In the most basic view of an object, you will see outward pointing arrows at its edges, which you can use to resize the object. If you click again, these arrows change direction and you can rotate the object. These arrows are called "manipulators" and they help you modify an object in a certain way.

Tool for working with nodes. When an object is selected and this tool is turned on, the "manipulators" will lose their appearance as arrows and become two shapes: like small squares and circles, and will give more ways to manipulate the object. The first thing you can do in this regard is, by deflecting the circles on the rectangle, make it rounded corners. By moving the circle lying on the ellipse, you will either get an object that looks like a pie with a cut out piece, or, if you draw a circle without going beyond the ellisp, an arc. The image on the left contains the object after dragging the node handle inside the circle, and the arc on the right appears after dragging the node handle outside the circle. Be prepared for the ellipse to flicker a little while doing this. The node tool is very useful for all of your objects.

Tweak tool. This group of tools focused on changing your subject - blur, movement, magnification and some other acts. As you move your mouse cursor over these tools, you can see what they do from the prompts. True, so far I have used them a little, but for the article I blurred the object using one of these tools.

Zoom tool. Oops, here's another tool to scale your drawing back and forth! By selecting it, you change the mouse cursor to a magnifying glass image with a plus inside. Left-clicking zooms in on objects, and right-click zooms out. You can also use the scroll wheel, but remember to hold down the CTRL key while doing this.
Rectangle. Lost between the tools is the "Rectangle", with which you can draw any rectangle. The following work technique has been adopted with it: you need to place your mouse cursor on the page, make a click, drag the mouse cursor and a rectangle will be drawn on the page. If you hold down the CTRL key while doing this, you get a square or rectangle with an integer aspect ratio. At the top of the page on the toolbar, you will see fields for entering the desired dimensions and coordinates.

3D Box tool. With this tool you can draw cubes in 3D. To control an object, you control the axes that appear along with it. You will need to experiment a bit with this.

Ellipse. This tool draws ellipses and circles. If you hold CTRL while dragging the mouse cursor, you will draw a real circle.

Star. If your desired object has three or more sides, use this tool. Together with its corresponding toolbar located above the page, you can choose whether it will be a polygon or a star, as well as set the number of corners that your object will have. In the case of a star, you can also set the ratio of the radii of the base and the top of the ray (the smaller this value, the sharper the star will be; the more the value approaches one, the more the star becomes like a circle). Below are two examples, in which both objects have 8 corners and the star has a radius ratio of 0.5. While the star tool is selected, you can change the appearance of your polygon or star by adding more corners, or by changing the ratio of the radii of its rays.

Spiral. This tool got its name from the fact that it draws spirals. Its toolbar is based on three settings: number of turns, nonlinearity, and inner radius. The first dictates how many times your line will wrap in a circle. Non-linearity means how much less frequently the outer lines follow one another than the inner ones, and the inner radius is the radius of the open area inside the spiral. On the left, the spiral has 9 turns, the nonlinearity is 2, and the inner radius is 0.5. The spiral on the right has 5 turns, the nonlinearity is 4 and the inner radius is 0.25. Again, if this tool is selected, you can, if you like, modify the spiral drawn earlier.

Pencil. With the Pencil tool it is possible to draw freehand lines on the page. While this is sometimes good, it is sensitive to the deviating behavior of the mouse cursor, so the Pen tool is better for drawing a perfectly straight line.
Feather. The Pen tool is used to draw Bezier curves and straight lines. A Bezier curve is drawn using control points that allow you to edit the curve. Below there are three lines: the top one is drawn with a pencil, the second is drawn with a pen, and the curve is a Bezier curve. Using the tools shown above your page, you can paint whatever you want. With this tool and knotting tool, you can actually draw a spiral as well, but with the spiral tool it is easier and faster to draw.

Calligraphic pen. This is a different Pen type tool, but with it you can draw calligraphic type lines. The settings of this tool, available above your page, will change the appearance of your line. You have 6 preset instruments, plus No Presets. This tool can create interesting variations of the drawn lines.

Text tool. It is a tool that allows you to enter your text. By selecting it and clicking with the mouse cursor on the page, you will get the cursor. Type your text and click on the top Text button to change the font and size. Your text will also be displayed there, so you can change it in case of a typo or any other correction you want to make.
Spray. The spray bottle is an interesting tool. It has three settings: "Spray copies of the selected object", "Spray clones of the selected object" and "Spray copies of the object, merging them into one path." If you make copies, each of the objects can be changed independently of the others, and if you make clones, all changes in the original will be reflected in its clones until you break the connection between them. If you spray objects by combining them into one path, you get an extension of the object you are using, everything is limited within the given stroke. Creating a cloud from an ellipse is an example of using this setup. In the example, the left ellipse is the original, and the cloud on the right is what I got by spraying copies of it and merging them into one path.

Eraser. This tool is similar to most other erasers: a small pink eraser. Select the object you want to erase and grab the eraser. The top toolbar shows the fill and stroke color that you will see during deletion; they are unnerving, but everything will be fine. If you do not select an object, all objects that you have dragged with the eraser will be deleted.

Solid fill. I think all fill tools are alike! Once you select a color, click on the area you want to paint. That's all.
Gradient fill. A gradient fill works with the Bucket and Stroke tool to create gradients together. Selecting a gradient in the Fill and Stroke window creates a gradient from the last color you used, from that color to transparency. However, clicking on the Gradient tool will help you see the direction of the gradient and change it if desired, as well as edit the gradient to create different effects. You can add so called anchor points, and change the color on each of them. You can arrange the above anchor points for the desired effect.

Pipette. This tool is a simple tool for choosing a color for an object's fill. Let's say you have two objects and you want them to be the same color. Select the one whose color you want to change, then select the eyedropper and place it in the color you want, and the object you selected will be painted in that color.
Connecting lines. With connecting lines, you can draw lines between objects. If you rearrange objects across the page, these lines stay between them, instead of just staying where they are. This is desirable for flowcharts or in other cases where you need lines between two objects. The settings allow connectors to ignore or walk around objects that you do not want to include in the connected object group. Below, lines have been drawn to connect the three ellipses, bypassing the central one. Connectors are strokes, so you can open Fill & Stroke and choose a style for your connector lines (wide lines, dashed lines, etc.)

These tools are ready for you to start painting with! You can pick some of them and try them out. Now it's time to look at the bottom of the window. Everything is pretty good there, there is a color palette, and in general the lower part of the window is rich in various information.
This board informs something about a chosen item. On the left side of the board informs about its fill and stroke, about their colors. You can use these colors to change them if you like. Clicking on any color in the palette changes the fill color, and clicking while holding down the Shift key changes the stroke color. Here are the colors of my circle selected below. To the right of the stroke color is the number 5. I used the same value to draw the ellipse as before to draw the rectangle for which I chose a 5px stroke size (obviously, I changed the fill color at the same time). There is a context menu with several standard sizes from which you can select the size of the stroke, or even remove it if you wish. Next comes the field with a value of 100. This is the transparency, which you can set here and also in the Fill and Stroke window. The next is the "eye", by clicking on which you can make the layer invisible, and the lock, by clicking on which you will lock the layer and after that you will not be able to change anything on it. The message "Ellipse in layer Layer 1" flaunts in the center. It looks like it is repeating the word Layer, but I think it means "Ellipse in layer Named Layer 1", so if you give the layer a different name, this line will be more correct. To the right, you can also see some useful text. Since we selected the ellipse with our selection tool, it tells us that if we click again, we can switch the tool to rotate the object. To the right of it we get the X and Y coordinates. They tell us about the current position of the mouse cursor. Finally, the percentage shows the scale of the view of our drawing.

I know this is a lot of information, but we will soon be able to understand its meaning. Keep in mind that Inkscape is designed to provide multiple ways to accomplish any task, so if you prefer to use one solution method (menu bar) for something, and your friend does the same thing differently (hotkeys), you both will love Inkscape.
Next time we will start a project.
Tags:
- inkscape
- vector graphics
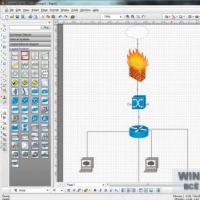 Free software for working with the network
 How the password generator works
 Recording video with sound from a computer screen: software overview Copying a computer screen program
 Getting Started with Mozilla Firefox - Download and Install
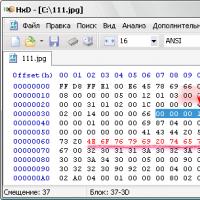 Best free hexadecimal editors (hex) Recover archives in WinRAR
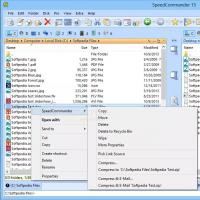 A guide to file managers for Windows
 Free program to permanently delete files File Shredder screenshots File shredder 2